HOT TOPICS LIST
- MACD
- Fibonacci
- RSI
- Gann
- ADXR
- Stochastics
- Volume
- Triangles
- Futures
- Cycles
- Volatility
- ZIGZAG
- MESA
- Retracement
- Aroon
INDICATORS LIST
LIST OF TOPICS
PRINT THIS ARTICLE
by Andrew Hetherington
Brocade Communications (BRCD) is ready to go with the others in the sector. . .
Position: N/A
Andrew Hetherington
Classic Dow Theorist who trades as a pure technician, using pattern recognition.
PRINT THIS ARTICLE
TRIANGLES
Descending Triangles: Brocade Communications Follows the Sector
05/03/02 10:51:49 AMby Andrew Hetherington
Brocade Communications (BRCD) is ready to go with the others in the sector. . .
Position: N/A
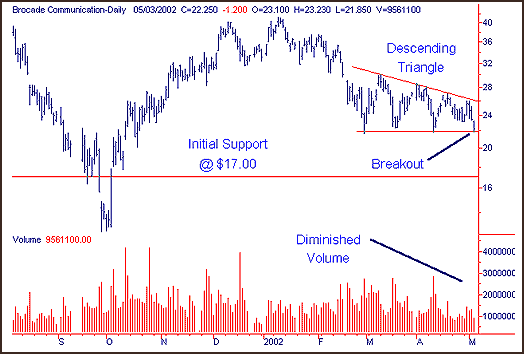
 Looking at Figure 1 above, a nicely developed 2-month descending triangle has formed as a result of the general market weakness. This triangle, which has a bearish tendency, has nicely diminished volume on the creation of the pattern. The breakout line is in the $21.85 area and it looks like it will be coming very soon. Although we have no help from our dependable fan lines on this chart, making it difficult to jump in early, we can anticipate the breakdown since the volume is increasing today (May 3, 2002). This increase in volume on the downside, which won't be visible until the end of the day, demonstrates the underlying weakness. I'm anticipating 25 million shares or higher today. |
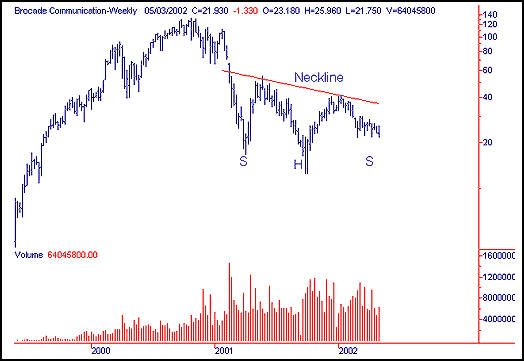
| In a recent article recapping the Network Appliance (NTAP) chart we see that the sector has become increasingly weak. In addition to this, the industry storage leader EMC Corporation (EMC) has been dropping steady and should head down to its next support in the $6.00 area from its current $8.00 level. The anticipated breakdown on BRCD should go down to the initial support of $17.00. It may eventually go slightly lower but this is a safe exit point on this shorting opportunity. The support in the $17.00 area will also be the approximate measurement on the pattern itself. The September low of $12.60 is not in jeopardy at this point since the much larger head and shoulders pattern on the weekly chart has the left shoulder bottom in the $16.75 area. Keeping in mind the tendency for symmetry on the shoulders places our anticipated right shoulder near $17.00. This is a fairly decent entry point to begin taking long positions. If your time horizon is medium to long term, this entry point will be a reasonable starting point to dollar cost average your position on the way down to try and catch the bottom. |

|
| Graphic provided by: SuperCharts. |
| |
Classic Dow Theorist who trades as a pure technician, using pattern recognition.
| Toronto, Canada |
Click here for more information about our publications!
Comments
Date: 05/04/02Rank: 5Comment: Excellent Article.
Date: 05/07/02Rank: 4Comment:

Request Information From Our Sponsors
- StockCharts.com, Inc.
- Candle Patterns
- Candlestick Charting Explained
- Intermarket Technical Analysis
- John Murphy on Chart Analysis
- John Murphy's Chart Pattern Recognition
- John Murphy's Market Message
- MurphyExplainsMarketAnalysis-Intermarket Analysis
- MurphyExplainsMarketAnalysis-Visual Analysis
- StockCharts.com
- Technical Analysis of the Financial Markets
- The Visual Investor
- VectorVest, Inc.
- Executive Premier Workshop
- One-Day Options Course
- OptionsPro
- Retirement Income Workshop
- Sure-Fire Trading Systems (VectorVest, Inc.)
- Trading as a Business Workshop
- VectorVest 7 EOD
- VectorVest 7 RealTime/IntraDay
- VectorVest AutoTester
- VectorVest Educational Services
- VectorVest OnLine
- VectorVest Options Analyzer
- VectorVest ProGraphics v6.0
- VectorVest ProTrader 7
- VectorVest RealTime Derby Tool
- VectorVest Simulator
- VectorVest Variator
- VectorVest Watchdog
