HOT TOPICS LIST
- MACD
- Fibonacci
- RSI
- Gann
- ADXR
- Stochastics
- Volume
- Triangles
- Futures
- Cycles
- Volatility
- ZIGZAG
- MESA
- Retracement
- Aroon
INDICATORS LIST
LIST OF TOPICS
PRINT THIS ARTICLE
by Mike Carr, CMT
Netflix has collapsed, but does that mean it is a buy?
Position: Hold
Mike Carr, CMT
Mike Carr, CMT, is a member of the Market Technicians Association, and editor of the MTA's newsletter, Technically Speaking. He is also the author of "Smarter Investing in Any Economy: The Definitive Guide to Relative Strength Investing," and "Conquering the Divide: How to Use Economic Indicators to Catch Stock Market Trends."
PRINT THIS ARTICLE
BOLLINGER BANDS
Netflix And Bottom Fishing
10/27/11 09:39:34 AMby Mike Carr, CMT
Netflix has collapsed, but does that mean it is a buy?
Position: Hold
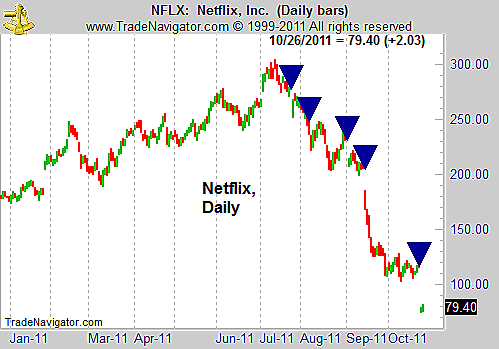
| Netflix (NFLX) collapsed after yet again delivering disappointing news to investors. This was its fifth gap down on news over the past four months (Figure 1). |

|
| FIGURE 1: NFLX, DAILY. Netflix is in a freefall. |
| Graphic provided by: Trade Navigator. |
| |
| A quick conclusion for the chart is that markets are not efficient. Academics believe that prices reflect all available information about a company. The number of downward gaps shows that investors have been reacting to the news from Netflix in a piecemeal fashion. No one seems able to understand what all the business model changes will mean over time, although there does seem to be agreement that the business outlook is negative. |
| After a decline in a big-name stock, there are always bottom-fishers, those hoping to catch a bottom and get a quick profit from a price recovery. As NFLX shows, there can be repeated drops in price and those who tried catching a bottom on the previous drops resulted in losses. |
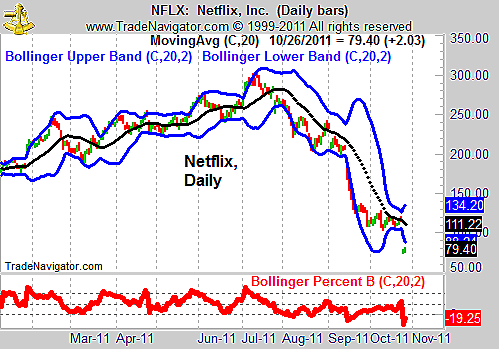
| Bollinger Bands and Bollinger Percent B can help spot bottoms. In Figure 2, however, we can see that this indicator is not offering a buy signal. Although prices fell below the lower Bollinger Band as they declined, the PercentB continued falling as well. Short-term bottoms will often be found when BollingerB shows a divergence, and patient investors can win on those few occasions when that setup occurs. |

|
| FIGURE 2: NFLX, DAILY. This chart gives no indication that it is time to buy this stock. |
| Graphic provided by: Trade Navigator. |
| |
| NFLX may bounce higher from its current deep oversold condition. But going long is a high-risk trade. Successful traders take low-risk entries rather than chasing oversold markets and hoping they won't get further oversold. |
Mike Carr, CMT, is a member of the Market Technicians Association, and editor of the MTA's newsletter, Technically Speaking. He is also the author of "Smarter Investing in Any Economy: The Definitive Guide to Relative Strength Investing," and "Conquering the Divide: How to Use Economic Indicators to Catch Stock Market Trends."
| Website: | www.moneynews.com/blogs/MichaelCarr/id-73 |
| E-mail address: | marketstrategist@gmail.com |
Click here for more information about our publications!
PRINT THIS ARTICLE

Request Information From Our Sponsors
- StockCharts.com, Inc.
- Candle Patterns
- Candlestick Charting Explained
- Intermarket Technical Analysis
- John Murphy on Chart Analysis
- John Murphy's Chart Pattern Recognition
- John Murphy's Market Message
- MurphyExplainsMarketAnalysis-Intermarket Analysis
- MurphyExplainsMarketAnalysis-Visual Analysis
- StockCharts.com
- Technical Analysis of the Financial Markets
- The Visual Investor
- VectorVest, Inc.
- Executive Premier Workshop
- One-Day Options Course
- OptionsPro
- Retirement Income Workshop
- Sure-Fire Trading Systems (VectorVest, Inc.)
- Trading as a Business Workshop
- VectorVest 7 EOD
- VectorVest 7 RealTime/IntraDay
- VectorVest AutoTester
- VectorVest Educational Services
- VectorVest OnLine
- VectorVest Options Analyzer
- VectorVest ProGraphics v6.0
- VectorVest ProTrader 7
- VectorVest RealTime Derby Tool
- VectorVest Simulator
- VectorVest Variator
- VectorVest Watchdog
