HOT TOPICS LIST
- MACD
- Fibonacci
- RSI
- Gann
- ADXR
- Stochastics
- Volume
- Triangles
- Futures
- Cycles
- Volatility
- ZIGZAG
- MESA
- Retracement
- Aroon
INDICATORS LIST
LIST OF TOPICS
PRINT THIS ARTICLE
by Donald W. Pendergast, Jr.
Some stocks rally quickly after making a major low, but others -- like Alcoa Aluminum -- just seem to take their sweet time.
Position: Buy
Donald W. Pendergast, Jr.
Donald W. Pendergast is a financial markets consultant who offers specialized services to stock brokers and high net worth individuals who seek a better bottom line for their portfolios.
PRINT THIS ARTICLE
TRADING SYSTEMS
Alcoa Setting Up For A Buy?
10/27/11 09:34:08 AMby Donald W. Pendergast, Jr.
Some stocks rally quickly after making a major low, but others -- like Alcoa Aluminum -- just seem to take their sweet time.
Position: Buy
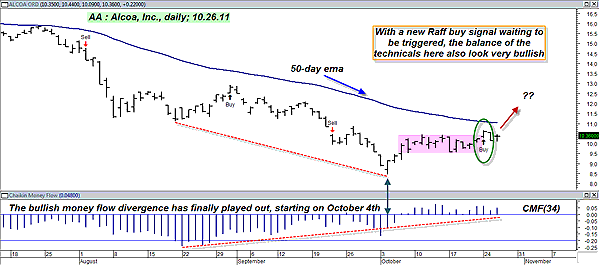
| The broad markets keep on hanging tough, and every day the public is getting closer to recognizing that this current move is likely going to have substantial staying power. In the meantime, smart traders and investors are busy scanning their stock databases for attractive long entry setups, relying on proven trading systems that have a history of catching most significant trend thrusts (in either direction). Alcoa, Inc. (AA), is also getting very close to a confirmed buy signal, as measured by the Raff MarketSpace stock system. |

|
| FIGURE 1: AA, DAILY. Once a bullish price/money flow divergence proves out, the next step is to wait for a low-risk buy signal from your proven trading system. Here, the Raff MarketSpace stock system has fired a new setup bar, but only a break above $10.67 will actually trigger the trade. |
| Graphic provided by: MetaStock. |
| Graphic provided by: Raff MarketSpace stock system from MetaStock 11. |
| |
| Prior to an enduring or major market low, you can frequently find many stocks beginning to manifest signs of price/money flow divergence, just like you see on this daily chart of AA (Figure 1). Once the market made the big low on October 4, 2011, the money flow trend kept rising, right along with prices, despite a brief period of range-bound action for a couple of weeks (pink shaded area). Currently, medium-term money flow (Chaikin money flow [CMF][34]) is well above its zero line, looking well able to support another trend thrust to higher price levels. AA sits just below its 50-period exponential moving average (EMA), and a daily close above this key trend-delineating average should only help further the bullish case in AA. A buy-stop break of $10.66 (Monday's high) will likely unleash a strong torrent of buying pressure, one that could have the power to help make the south side of the 50-period EMA a distant memory. Only time will tell, of course. |
| Covered calls are always an option (pardon the pun) for conservative traders, but until the CS Scientific Hybrid Trade screen (one of the expert advisors in MetaStock 11) rates AA with a more bullish rating, the best strategy to a long buy-stop entry near $10.67 is to place the buy order, and if filled, to then follow up the position with a two- to three-bar trailing stop of the daily lows (use two bars if you are the nervous type and three if you feel more comfortable in letting AA find its own way with less restriction). Either way, you should use modest trade sizing so that your account risk is limited to 1% or 2% maximum of your equity account's value. |
Donald W. Pendergast is a financial markets consultant who offers specialized services to stock brokers and high net worth individuals who seek a better bottom line for their portfolios.
| Title: | Writer, market consultant |
| Company: | Linear Trading Systems LLC |
| Jacksonville, FL 32217 | |
| Phone # for sales: | 904-239-9564 |
| E-mail address: | lineartradingsys@gmail.com |
Traders' Resource Links | |
| Linear Trading Systems LLC has not added any product or service information to TRADERS' RESOURCE. | |
Click here for more information about our publications!
PRINT THIS ARTICLE

Request Information From Our Sponsors
- StockCharts.com, Inc.
- Candle Patterns
- Candlestick Charting Explained
- Intermarket Technical Analysis
- John Murphy on Chart Analysis
- John Murphy's Chart Pattern Recognition
- John Murphy's Market Message
- MurphyExplainsMarketAnalysis-Intermarket Analysis
- MurphyExplainsMarketAnalysis-Visual Analysis
- StockCharts.com
- Technical Analysis of the Financial Markets
- The Visual Investor
- VectorVest, Inc.
- Executive Premier Workshop
- One-Day Options Course
- OptionsPro
- Retirement Income Workshop
- Sure-Fire Trading Systems (VectorVest, Inc.)
- Trading as a Business Workshop
- VectorVest 7 EOD
- VectorVest 7 RealTime/IntraDay
- VectorVest AutoTester
- VectorVest Educational Services
- VectorVest OnLine
- VectorVest Options Analyzer
- VectorVest ProGraphics v6.0
- VectorVest ProTrader 7
- VectorVest RealTime Derby Tool
- VectorVest Simulator
- VectorVest Variator
- VectorVest Watchdog
