HOT TOPICS LIST
- MACD
- Fibonacci
- RSI
- Gann
- ADXR
- Stochastics
- Volume
- Triangles
- Futures
- Cycles
- Volatility
- ZIGZAG
- MESA
- Retracement
- Aroon
INDICATORS LIST
LIST OF TOPICS
PRINT THIS ARTICLE
by Donald W. Pendergast, Jr.
In a tough economy, the dollar stores tend to increase their market share -- and the price of their respective stocks as well.
Position: N/A
Donald W. Pendergast, Jr.
Donald W. Pendergast is a financial markets consultant who offers specialized services to stock brokers and high net worth individuals who seek a better bottom line for their portfolios.
PRINT THIS ARTICLE
NEW HIGHS-NEW LOWS
With Family Dollar, The New Highs Keep Arriving
10/27/11 11:41:36 AMby Donald W. Pendergast, Jr.
In a tough economy, the dollar stores tend to increase their market share -- and the price of their respective stocks as well.
Position: N/A
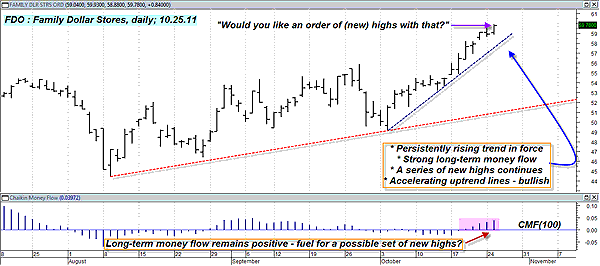
| Family Dollar (FDO) shares have been on a veritable tear since early October, not to mention also having managed to outperform the broad markets by a large margin during the terrifying stock smash of July-August 2011. Here's a closer look at the daily chart of this discount retailer's stock (Figure 1). |

|
| FIGURE 1: FDO, DAILY. "Buy high and sell higher" -- well, that's the idea here, at any rate. Using proper risk control on covered-call and straight stock trades is still essential, no matter how powerfully a stock may be trending. |
| Graphic provided by: MetaStock. |
| Graphic provided by: Deel New Highs screen from MetaStock 11. |
| |
| It's always impressive to see a stock that's doing well during times of general market mayhem (think July through September of this year), one that also has the ability to go on a truly bullish tear once the market settles down. FDO appears to be more than able to do all of this, and a stock that actually rose by nearly 20% between early August and late September should be given every benefit of the doubt, given its exraordinary ability to outperform in an extremely negative market environment. Examining FDO's daily chart, we find that the stock features a set of accelerating uptrend lines and positive long-term money flow even as it keeps on racking up new 52-week highs. Conservative investors and big-money institutions are apparently having little trouble in committing substantial sums of investment capital into the stock, hence the series of new yearly highs. |
| This is the kind of chart setup that seems to scream "Covered call, covered call!" but it's really up to the individual trader to decide how best to interact with FDO at this juncture. When a stock keeps on making new 52-week highs, it seems to just keep on grinding higher, up to a point that only the stock itself seems to know. While it's trending higher in the wake of such new highs, it's usually a good time to latch onto a powerful trend and ride it for all it's worth. Using a near-term, at-the-money covered-call trade that relies on a 21-period daily exponential moving average (EMA) as an initial/trailing stop might be one of the simplest and most effective ways to manage such a buy-write combo. Try it out and see -- maybe just paper-trade a near-term covered call in FDO using that trade management method and see if it doesn't make sound trading sense to you -- and maybe make a few extra dollars for you too. |
Donald W. Pendergast is a financial markets consultant who offers specialized services to stock brokers and high net worth individuals who seek a better bottom line for their portfolios.
| Title: | Writer, market consultant |
| Company: | Linear Trading Systems LLC |
| Jacksonville, FL 32217 | |
| Phone # for sales: | 904-239-9564 |
| E-mail address: | lineartradingsys@gmail.com |
Traders' Resource Links | |
| Linear Trading Systems LLC has not added any product or service information to TRADERS' RESOURCE. | |
Click here for more information about our publications!
PRINT THIS ARTICLE

Request Information From Our Sponsors
- StockCharts.com, Inc.
- Candle Patterns
- Candlestick Charting Explained
- Intermarket Technical Analysis
- John Murphy on Chart Analysis
- John Murphy's Chart Pattern Recognition
- John Murphy's Market Message
- MurphyExplainsMarketAnalysis-Intermarket Analysis
- MurphyExplainsMarketAnalysis-Visual Analysis
- StockCharts.com
- Technical Analysis of the Financial Markets
- The Visual Investor
- VectorVest, Inc.
- Executive Premier Workshop
- One-Day Options Course
- OptionsPro
- Retirement Income Workshop
- Sure-Fire Trading Systems (VectorVest, Inc.)
- Trading as a Business Workshop
- VectorVest 7 EOD
- VectorVest 7 RealTime/IntraDay
- VectorVest AutoTester
- VectorVest Educational Services
- VectorVest OnLine
- VectorVest Options Analyzer
- VectorVest ProGraphics v6.0
- VectorVest ProTrader 7
- VectorVest RealTime Derby Tool
- VectorVest Simulator
- VectorVest Variator
- VectorVest Watchdog
