HOT TOPICS LIST
- MACD
- Fibonacci
- RSI
- Gann
- ADXR
- Stochastics
- Volume
- Triangles
- Futures
- Cycles
- Volatility
- ZIGZAG
- MESA
- Retracement
- Aroon
INDICATORS LIST
LIST OF TOPICS
PRINT THIS ARTICLE
by Koos van der Merwe
What does the future hold for Apple, now that cofounder Steve Jobs has passed away?
Position: Sell
Koos van der Merwe
Has been a technical analyst since 1969, and has worked as a futures and options trader with First Financial Futures in Johannesburg, South Africa.
PRINT THIS ARTICLE
ELLIOTT WAVE
Is It Worth Taking A Bite Out Of Apple?
10/25/11 08:54:08 AMby Koos van der Merwe
What does the future hold for Apple, now that cofounder Steve Jobs has passed away?
Position: Sell
| With the loss of Steve Jobs, the share price of Apple (AAPL) dropped from a high of $422.86 to a low of $354. Since then, the share price has recovered, as management suggests that the genius of Steve Jobs is still with Apple. The drop in share price was also not because of the cofounder's death, but because the performance of the company was below analyst expectations, which was blamed on buyers of the iPhone, who waited for the 4S to become available. |

|
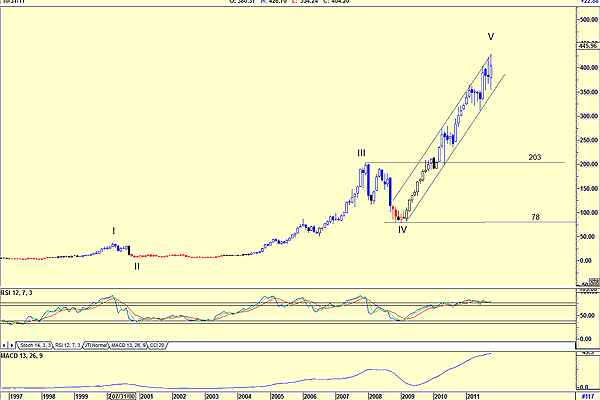
| FIGURE 1: AAPL, MONTHLY |
| Graphic provided by: AdvancedGET. |
| |
| However, the monthly chart of Apple does look troublesome (Figure 1). The chart is suggesting that a wave V top is forming, with a drop to somewhere between the $78 and $203 level. The relative strength index (RSI ) is at overbought levels, and suggests this possibility, but a look back at previous RSI oversold levels suggests that this need not be the case. The moving average convergence/divergence (MACD) oscillator seems to be a more reliable indicator, even though it is late. |

|
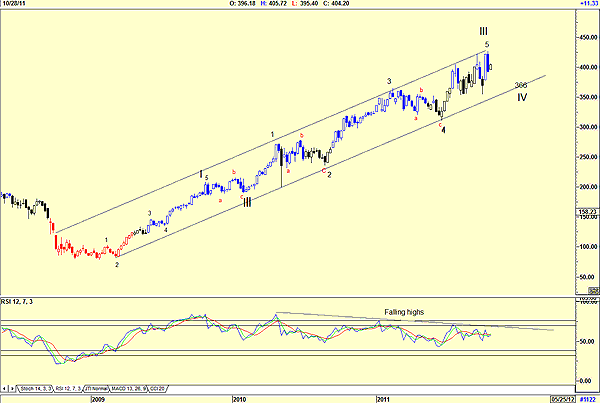
| FIGURE 2: AAPL, WEEKLY |
| Graphic provided by: AdvancedGET. |
| |
| The weekly chart in Figure 2 suggests that the share price is completing a wave III high and could fall into a wave IV, which will see it test the $366 level, finding support on the trendline. This is confirmed by the divergence suggested by the RSI, which is showing falling highs compared to the share price's higher highs. |

|
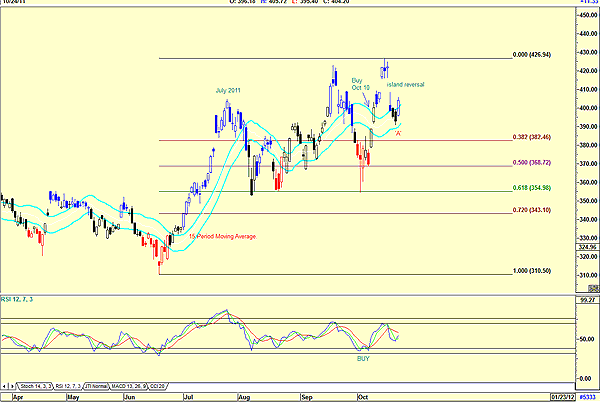
| FIGURE 3: APPLE, DAILY |
| Graphic provided by: AdvancedGET. |
| |
| Finally, the daily chart in Figure 3 shows the extreme volatility in the share price since July 2011. The chart shows a triple bottom at $354.98, the 61.8% level of the Fibonacci retracement from the low of $310.50 to the high of $426.94. The chart is also suggesting a possible double-top high at $426.94, but not that definite to be proof-positive. The RSI did give a buy signal early October and has not moved into oversold. The JM internal band indicator also gave a buy signal on October 10, and although it came close to testing the lower band at A, it never fell below it, suggesting a short. However, it did break below the 15-period simple moving average, which is acting as a stop-loss level. Finally, do note the island reversal that formed. An island reversal is formed on a rising gap followed by a falling gap and is a very -- in this case -- negative indicator. I would be a nervous holder of Apple shares at the moment and would be happy to take money off the table, and look to buy at lower levels. |
Has been a technical analyst since 1969, and has worked as a futures and options trader with First Financial Futures in Johannesburg, South Africa.
| Address: | 3256 West 24th Ave |
| Vancouver, BC | |
| Phone # for sales: | 6042634214 |
| E-mail address: | petroosp@gmail.com |
Click here for more information about our publications!
Comments
Date: 10/25/11Rank: 5Comment:

Request Information From Our Sponsors
- StockCharts.com, Inc.
- Candle Patterns
- Candlestick Charting Explained
- Intermarket Technical Analysis
- John Murphy on Chart Analysis
- John Murphy's Chart Pattern Recognition
- John Murphy's Market Message
- MurphyExplainsMarketAnalysis-Intermarket Analysis
- MurphyExplainsMarketAnalysis-Visual Analysis
- StockCharts.com
- Technical Analysis of the Financial Markets
- The Visual Investor
- VectorVest, Inc.
- Executive Premier Workshop
- One-Day Options Course
- OptionsPro
- Retirement Income Workshop
- Sure-Fire Trading Systems (VectorVest, Inc.)
- Trading as a Business Workshop
- VectorVest 7 EOD
- VectorVest 7 RealTime/IntraDay
- VectorVest AutoTester
- VectorVest Educational Services
- VectorVest OnLine
- VectorVest Options Analyzer
- VectorVest ProGraphics v6.0
- VectorVest ProTrader 7
- VectorVest RealTime Derby Tool
- VectorVest Simulator
- VectorVest Variator
- VectorVest Watchdog
