HOT TOPICS LIST
- MACD
- Fibonacci
- RSI
- Gann
- ADXR
- Stochastics
- Volume
- Triangles
- Futures
- Cycles
- Volatility
- ZIGZAG
- MESA
- Retracement
- Aroon
INDICATORS LIST
LIST OF TOPICS
PRINT THIS ARTICLE
by Billy Williams
Breakout stocks move fast and furiously, but having a clear set of guidelines as a checklist can help you trade accurately and with precision.
Position: Hold
Billy Williams
Billy Williams has been trading the markets for 27 years, specializing in momentum trading with stocks and options.
PRINT THIS ARTICLE
BREAKOUTS
Checklist For Breakout Setups
10/24/11 01:49:07 PMby Billy Williams
Breakout stocks move fast and furiously, but having a clear set of guidelines as a checklist can help you trade accurately and with precision.
Position: Hold
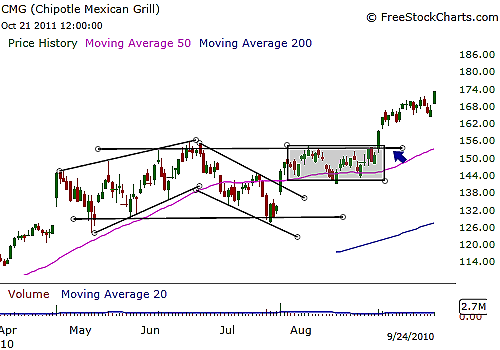
| Breakout moves possess enormous potential for above-average returns, but they also tend to move in flurries as several stocks across the board will be carried higher due to the leadership that these stocks offer the overall market. Average stocks tend to move in tandem with the overall stock market by as much as 70% to 80%. This can create challenges for the trader who is trying to find the best breakout setup in order to maximize his return on the capital that he is risking in a possible position without missing the move or entering the wrong stock at the right time. This is where it's handy to have a set of key factors in place that you can refer back to in order to filter out the bad trades and keep the key criteria for runaway stocks within arm's length to remind you of what is vital to your success and what to avoid. See Figure 1. |

|
| FIGURE 1: CMG. CMG contracted within a tight base from late April 2010 to September 1, 2010, when it broke out on higher volume. |
| Graphic provided by: www.freestockcharts.com. |
| |
| First, look for stocks that have a long base of at least eight weeks or more -- the longer, the better. Price action moves between price expansion and price contraction, the yin/yang element that is indicative to movement in the stock market. When stocks are appreciating or depreciating in price, it is considered to be in the expansion phase of its cycle, while if it is in price contraction, then it is oscillating back-and-forth in a defined trading range until either the bulls or bears seize control of the trend. The longer a stock is in contraction, the more likely it will exhibit a great deal of velocity when it breaks out and moves into expansion, which offers the chance for a huge profit in a short holding time. Second, leading up to the breakout, look for price to tighten as it drifts higher to overhead resistance. Price tends to drift to the right before it breaks through the overhead resistance point of the contracted trading range it is currently experiencing, almost as if it is gathering steam for a strong move to punch higher and through this price level. It is in this phase of the breakout setup that you need to be keenly aware of what is going on so that once the stock breaks out, you're not left behind. |

|
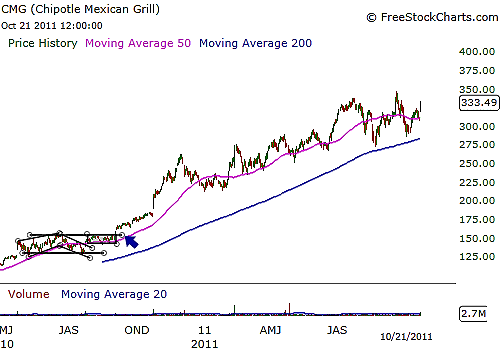
| FIGURE 2: CMG. CMG offered a entry point of $155 to $157 before climbing higher to a price high of just over $346, offering a potential 100%+ return. Today, CMG still trades near its all-time price high even as the overall stock market struggles, which reveals a great deal of strength in its price action. |
| Graphic provided by: www.freestockcharts.com. |
| |
| Third, expect a big one-day move where you see the stock breakout through its overhead resistance level on huge volume. Volume is the fuel that sends a stock higher, and for smaller to mid-size companies, you can expect two to three times the normal volume level that have been the 20-day average. On larger-size stocks, look to confirm the breakout when 1-1/2 times the normal 20-day average volume has been achieved. Fourth, make sure the overall market is in a confirmed uptrend. This can be tricky and take some skill because breakout stocks tend to emerge as the stock leadership that takes the rest of the market higher. So, it is common for stock leadership to move higher before the rest of the market, but as long as you recognize that the overall market is holding or drifting higher, both stock leadership and the general market will reinforce each other's moves and explode higher. See Figure 2. |
| The fifth thing you want to watch for was touched upon in the fourth point of the checklist, which is to watch for stock leaders that are setting up and moving higher, but specifically, watch what their cousin stocks are doing. Stock leaders' moves in price act as a magnet to other stocks in the same or similar industries, causing them to make similar moves. If the cousin stocks don't move along with the leaders, it could act as a drag on their ability to expand in price. Finally, trade those stocks that are breaking out that have a relative strength (RS) higher than 70. RS is an indicator that rates how strong a stock is performing compared to the rest of the stock market. It scores from zero, the lowest score, to as high as 100, the strongest reading for performance. |
| When trading, RS will be the cornerstone factor when determining whether to trade a stock at all, since strength is a better indicator of performance than just buying a stock because it is low. Write these guidelines down and keep them close at hand whenever you are considering trading a breakout move. You will be less likely to get caught up in the excitement of the move and more likely to pick off a winning breakout stock with the laser-like precision and machine-like accuracy of a sniper than not having a clear set of rules to guide your actions when things move fast in today's market. |
Billy Williams has been trading the markets for 27 years, specializing in momentum trading with stocks and options.
| Company: | StockOptionSystem.com |
| E-mail address: | stockoptionsystem.com@gmail.com |
Traders' Resource Links | |
| StockOptionSystem.com has not added any product or service information to TRADERS' RESOURCE. | |
Click here for more information about our publications!
Comments

Request Information From Our Sponsors
- StockCharts.com, Inc.
- Candle Patterns
- Candlestick Charting Explained
- Intermarket Technical Analysis
- John Murphy on Chart Analysis
- John Murphy's Chart Pattern Recognition
- John Murphy's Market Message
- MurphyExplainsMarketAnalysis-Intermarket Analysis
- MurphyExplainsMarketAnalysis-Visual Analysis
- StockCharts.com
- Technical Analysis of the Financial Markets
- The Visual Investor
- VectorVest, Inc.
- Executive Premier Workshop
- One-Day Options Course
- OptionsPro
- Retirement Income Workshop
- Sure-Fire Trading Systems (VectorVest, Inc.)
- Trading as a Business Workshop
- VectorVest 7 EOD
- VectorVest 7 RealTime/IntraDay
- VectorVest AutoTester
- VectorVest Educational Services
- VectorVest OnLine
- VectorVest Options Analyzer
- VectorVest ProGraphics v6.0
- VectorVest ProTrader 7
- VectorVest RealTime Derby Tool
- VectorVest Simulator
- VectorVest Variator
- VectorVest Watchdog
