HOT TOPICS LIST
- MACD
- Fibonacci
- RSI
- Gann
- ADXR
- Stochastics
- Volume
- Triangles
- Futures
- Cycles
- Volatility
- ZIGZAG
- MESA
- Retracement
- Aroon
INDICATORS LIST
LIST OF TOPICS
PRINT THIS ARTICLE
by Chaitali Mohile
Will the stock form a strong bottom to initiate a bullish rally?
Position: N/A
Chaitali Mohile
Active trader in the Indian stock markets since 2003 and a full-time writer. Trading is largely based upon technical analysis.
PRINT THIS ARTICLE
CONSOLID FORMATION
Comerica Consolidating At The Lower End
10/24/11 01:27:54 PMby Chaitali Mohile
Will the stock form a strong bottom to initiate a bullish rally?
Position: N/A
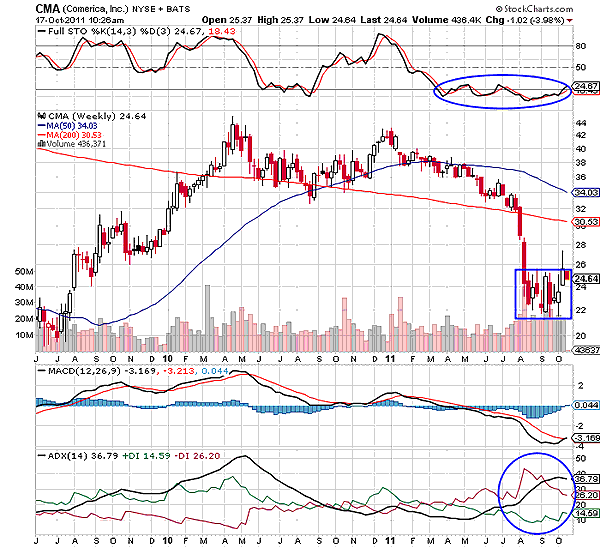
| Similar to other stocks in the financial markets, Comerica Inc. (CMA) is undergoing a bearish rally. Earlier, CMA established a strong support at the descending 200-day moving average (MA) on its weekly time frame in Figure 1. There were two bearish indications on the chart -- a lower high formed by the price rally and the descending 200-day MA. Further, the 50-day moving average that had surged above the long-term MA began declining as well. Hence, the price chart was highlighting a potential bearish breakout. However, the full stochastic (14,3,3) was zigzagging between oversold and overbought regions. The oscillator moved horizontally in the oversold area as price moved closer to the 200-day MA, breaching the 50-day MA support. Generally, an oversold stochastic indicates the possibility of a fresh bullish rally. The scene in Figure 1 is completely different. Although the oscillator was oversold for a longer time, CMA breached the 200-day MA support and plunged harder. |
| The moving average convergence/divergence (MACD) (12,26,9) turned negative because the gap the between the trigger line and the MACD line reduced drastically. It also formed lower highs before breaking the zero line, suggesting high bearish pressure and volatility for CMA. An overheated uptrend in Figure 1 turned weaker, inducing equal buying and selling pressure in the rally. The bearish breakout of the 200-day MA developed a fresh downtrend for CMA. We can see that the average directional index (ADX) (14) slipped above 20 levels with huge selling pressure, generating the new bearish trend. |

|
| FIGURE 1: CMA, WEEKLY |
| Graphic provided by: StockCharts.com. |
| |
| Currently, CMA is consolidating at the bottom of the rally between 21.50 and 25.50. In the past two to three months, the stock has been ranging in this area. The lower consolidating range is the previous bullish breakout point (see the breakout point of 2009), and therefore, it holds strong bullish support; thus, the stock is unlikely to plunge below this (21.50) level. The momentum oscillator is still oversold and the negative moving average convergence/divergence (MACD) (12,26,9) is likely to undergo a bullish crossover in negative territory while the ADX (14) is reflecting the well-developed downtrend. Although the bottom is being constructed Figure 1, the indicators are not reflecting the possibility of a trend reversal. In such conditions, CMA would continue to consolidate for some time. The bullish breakout can be anticipated only if the indicators turn bullish and price thrusts up at the upper consolidating range. |

|
| FIGURE 2: CMA, DAILY |
| Graphic provided by: StockCharts.com. |
| |
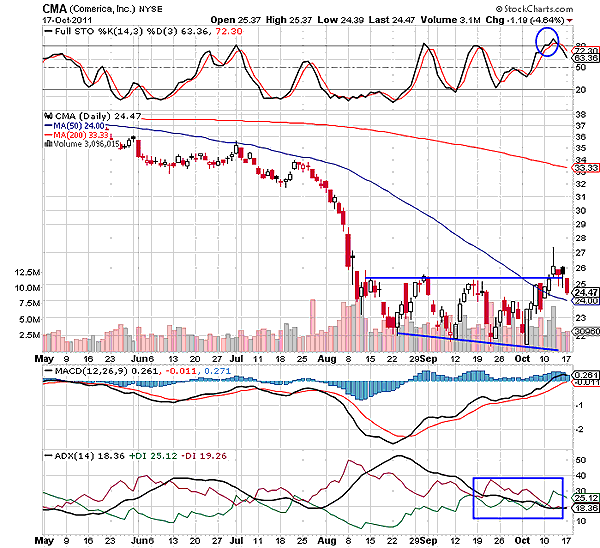
| The daily time frame in Figure 2 would show us the road map for the intraday trading opportunity as well as the potential breakout direction. The declining MAs are diverging and the price is moving under the 50-day MA pressure. After plunging below 25 levels, the vertical rally moved sideways in a relatively wide range between 21.50 and 25.50. According to Figure 2, the lower consolidation range is forming a lower low. Therefore, the lowest point at 21.50 is considered as the lower range. Will the stock undergo a bullish breakout? |
| The stochastic has formed a triple top at 70 levels, indicating that CMA could undergo a bearish rally. The buying pressure (green line) and selling pressure (red line) are converging, suggesting consolidation for the stock. The MACD (12,26,9) is ready to hit the zero line. However, the weakness in the other two indicators would put a negative impact on the climbing MACD (12,26,9) in Figure 2. The upper consolidation range was challenged but there wasn't enough bullish strength in CMA to convert resistance to support. The stock is ready to retrace toward the lower consolidation range. Thus, traders can grab this opportunity to go short below the 50-day MA support with a small target of the lower consolidation range. To conclude, CMA is unlikely to initiate a fresh bullish breakout in the next few trading sessions. |
Active trader in the Indian stock markets since 2003 and a full-time writer. Trading is largely based upon technical analysis.
| Company: | Independent |
| Address: | C1/3 Parth Indraprasth Towers. Vastrapur |
| Ahmedabad, Guj 380015 | |
| E-mail address: | chaitalimohile@yahoo.co.in |
Traders' Resource Links | |
| Independent has not added any product or service information to TRADERS' RESOURCE. | |
Click here for more information about our publications!
PRINT THIS ARTICLE

Request Information From Our Sponsors
- StockCharts.com, Inc.
- Candle Patterns
- Candlestick Charting Explained
- Intermarket Technical Analysis
- John Murphy on Chart Analysis
- John Murphy's Chart Pattern Recognition
- John Murphy's Market Message
- MurphyExplainsMarketAnalysis-Intermarket Analysis
- MurphyExplainsMarketAnalysis-Visual Analysis
- StockCharts.com
- Technical Analysis of the Financial Markets
- The Visual Investor
- VectorVest, Inc.
- Executive Premier Workshop
- One-Day Options Course
- OptionsPro
- Retirement Income Workshop
- Sure-Fire Trading Systems (VectorVest, Inc.)
- Trading as a Business Workshop
- VectorVest 7 EOD
- VectorVest 7 RealTime/IntraDay
- VectorVest AutoTester
- VectorVest Educational Services
- VectorVest OnLine
- VectorVest Options Analyzer
- VectorVest ProGraphics v6.0
- VectorVest ProTrader 7
- VectorVest RealTime Derby Tool
- VectorVest Simulator
- VectorVest Variator
- VectorVest Watchdog
