HOT TOPICS LIST
- MACD
- Fibonacci
- RSI
- Gann
- ADXR
- Stochastics
- Volume
- Triangles
- Futures
- Cycles
- Volatility
- ZIGZAG
- MESA
- Retracement
- Aroon
INDICATORS LIST
LIST OF TOPICS
PRINT THIS ARTICLE
by Donald W. Pendergast, Jr.
Shares of Sherwin Williams appear to be in prime position to rally along with the rest of the broad market after Thursday, October 20's notable intraday reversal.
Position: Buy
Donald W. Pendergast, Jr.
Donald W. Pendergast is a financial markets consultant who offers specialized services to stock brokers and high net worth individuals who seek a better bottom line for their portfolios.
PRINT THIS ARTICLE
Is A Sherwin Williams Breakout Looming From Consolidation?
10/21/11 10:59:54 AMby Donald W. Pendergast, Jr.
Shares of Sherwin Williams appear to be in prime position to rally along with the rest of the broad market after Thursday, October 20's notable intraday reversal.
Position: Buy
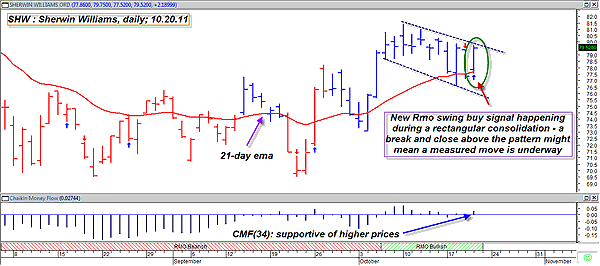
| With a single glance, a skilled technician would be able to recognize the bullish rectangle pattern on Sherwin Williams' (SHW) daily chart (Figure 1): It's a near-textbook quality pattern, one that in the current broad market scenario should attract more than a few serious traders to take a shot here on the long side. The new Rahul Mohindar (RMO) swing buy signal has printed at a fairly mature point in the development of this ordinarily bullish consolidation pattern, and a breakout above the upper channel line will likely be a major buy signal for bulls. Given that the medium-term Chaikin money flow (CMF)(34) has been hanging tough near its zero line during the formation of the rectangle pattern, there seems to be no shortage of reasons to enter long SHW on a buy-stop break above $79.75. |

|
| FIGURE 1: SHW, DAILY. Beautiful, bullishly postured rectangle patterns like this aren't everyday occurrences, so it pays to be prepared to take advantage of them when they do decide to show up. |
| Graphic provided by: MetaStock. |
| Graphic provided by: RMO indicators and tools from MetaStock 11. |
| |
| Traders considering a long entry here might want to run a two- to three-bar trailing stop of the daily lows, holding the position until the final stopout. Depending on several factors such as account size, risk tolerance, and trading skill level, the total risk to the account should probably be limited to no more than 1% or 2%. For example, if you anticipate your long entry to be filled at $79.79, and your initial stop is $76.50, your risk per share would be $3.29. Therefore, on a 50-share purchase, the account risk would be about $164. If you had a $20,000 account, your risk is only about 0.81%, which is pretty conservative. Over time, you'll probably be able to fine-tune your allocations to help minimize risk during iffy market phases, even as you learn to maximize gains during obviously bullish phases. |
Donald W. Pendergast is a financial markets consultant who offers specialized services to stock brokers and high net worth individuals who seek a better bottom line for their portfolios.
| Title: | Writer, market consultant |
| Company: | Linear Trading Systems LLC |
| Jacksonville, FL 32217 | |
| Phone # for sales: | 904-239-9564 |
| E-mail address: | lineartradingsys@gmail.com |
Traders' Resource Links | |
| Linear Trading Systems LLC has not added any product or service information to TRADERS' RESOURCE. | |
Click here for more information about our publications!
PRINT THIS ARTICLE

Request Information From Our Sponsors
- StockCharts.com, Inc.
- Candle Patterns
- Candlestick Charting Explained
- Intermarket Technical Analysis
- John Murphy on Chart Analysis
- John Murphy's Chart Pattern Recognition
- John Murphy's Market Message
- MurphyExplainsMarketAnalysis-Intermarket Analysis
- MurphyExplainsMarketAnalysis-Visual Analysis
- StockCharts.com
- Technical Analysis of the Financial Markets
- The Visual Investor
- VectorVest, Inc.
- Executive Premier Workshop
- One-Day Options Course
- OptionsPro
- Retirement Income Workshop
- Sure-Fire Trading Systems (VectorVest, Inc.)
- Trading as a Business Workshop
- VectorVest 7 EOD
- VectorVest 7 RealTime/IntraDay
- VectorVest AutoTester
- VectorVest Educational Services
- VectorVest OnLine
- VectorVest Options Analyzer
- VectorVest ProGraphics v6.0
- VectorVest ProTrader 7
- VectorVest RealTime Derby Tool
- VectorVest Simulator
- VectorVest Variator
- VectorVest Watchdog
