HOT TOPICS LIST
- MACD
- Fibonacci
- RSI
- Gann
- ADXR
- Stochastics
- Volume
- Triangles
- Futures
- Cycles
- Volatility
- ZIGZAG
- MESA
- Retracement
- Aroon
INDICATORS LIST
LIST OF TOPICS
PRINT THIS ARTICLE
by Mike Carr, CMT
Traders look for volatility to rise as markets fall, but profiting from that insight can be a challenge. Even if you don't trade volatility, you should still follow this reliable market indicator.
Position: Sell
Mike Carr, CMT
Mike Carr, CMT, is a member of the Market Technicians Association, and editor of the MTA's newsletter, Technically Speaking. He is also the author of "Smarter Investing in Any Economy: The Definitive Guide to Relative Strength Investing," and "Conquering the Divide: How to Use Economic Indicators to Catch Stock Market Trends."
PRINT THIS ARTICLE
CHART ANALYSIS
Volatility Still Bullish
10/20/11 09:42:59 AMby Mike Carr, CMT
Traders look for volatility to rise as markets fall, but profiting from that insight can be a challenge. Even if you don't trade volatility, you should still follow this reliable market indicator.
Position: Sell
| Volatility in the stock market is usually followed with the CBOE Volatility Index (VIX), designed to measure the volatility of large-cap stocks. Other volatility indexes are available, and all follow the same general rule: Volatility rises when prices decline. This makes the VIX a useful tool to confirm stock market trends. |
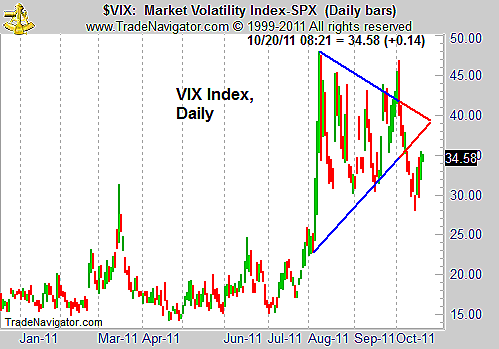
| In Figure 1, we see that volatility has recently broken down from a triangle pattern. A throwback is occurring, but the lower line of the triangle should provide resistance. Lower volatility supports higher stock prices. |

|
| FIGURE 1: VIX, DAILY. The triangle in VIX was broken to the downside, and lower volatility should be expected based on that indicator. |
| Graphic provided by: Trade Navigator. |
| |
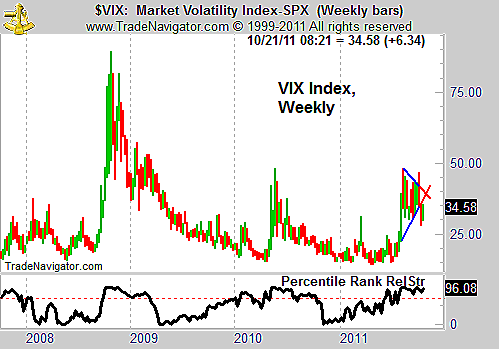
| Figure 2 highlights the recent strength of VIX over the longer term. The weekly chart includes an "Investor's Business Daily" (IBD)-style relative strength (RS) rank calculation. This differs significantly from the IBD rank because it includes futures as well as stocks in the universe and it is based on a different formula. Interpretation of the indicator is similar, and the VIX has been among the strongest investments available since June 2011. |

|
| FIGURE 2: VIX, WEEKLY. Longer term, VIX has shown a very high RS rank but is a volatile investment. RS is more mean reverting in VIX than in stocks. |
| Graphic provided by: Trade Navigator. |
| |
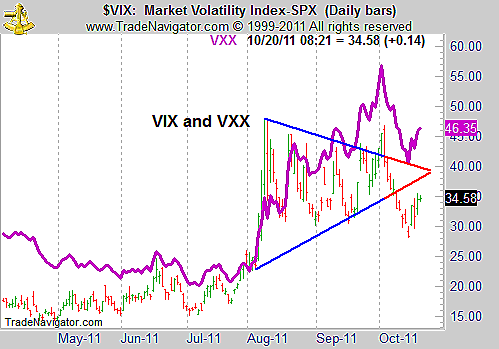
| The rapid swings from high to low RS make VIX challenging to trade. It is best to think of volatility as a short-term hedge, and we need to remember to take profits instead of holding for weeks or months. Using an exchange traded fund (ETF) like VXX to trade the VIX is likely to lead to disappointing results. Figure 3 adds VXX and shows that patterns are less well defined in the ETF. Although the two generally track each other, the correlation breaks down over short periods, and those are likely to be the most profitable times in a VIX trade. |

|
| FIGURE 3: VIX, DAILY. VXX is an imperfect trading vehicle for VIX. |
| Graphic provided by: Trade Navigator. |
| |
| VIX can be directly traded with futures. Even without trading, volatility is a useful technical indicator on its own. The breakdown from the recent triangle pattern is consistent with lower volatility and higher stock prices in the near term. |
Mike Carr, CMT, is a member of the Market Technicians Association, and editor of the MTA's newsletter, Technically Speaking. He is also the author of "Smarter Investing in Any Economy: The Definitive Guide to Relative Strength Investing," and "Conquering the Divide: How to Use Economic Indicators to Catch Stock Market Trends."
| Website: | www.moneynews.com/blogs/MichaelCarr/id-73 |
| E-mail address: | marketstrategist@gmail.com |
Click here for more information about our publications!
Comments

Request Information From Our Sponsors
- StockCharts.com, Inc.
- Candle Patterns
- Candlestick Charting Explained
- Intermarket Technical Analysis
- John Murphy on Chart Analysis
- John Murphy's Chart Pattern Recognition
- John Murphy's Market Message
- MurphyExplainsMarketAnalysis-Intermarket Analysis
- MurphyExplainsMarketAnalysis-Visual Analysis
- StockCharts.com
- Technical Analysis of the Financial Markets
- The Visual Investor
- VectorVest, Inc.
- Executive Premier Workshop
- One-Day Options Course
- OptionsPro
- Retirement Income Workshop
- Sure-Fire Trading Systems (VectorVest, Inc.)
- Trading as a Business Workshop
- VectorVest 7 EOD
- VectorVest 7 RealTime/IntraDay
- VectorVest AutoTester
- VectorVest Educational Services
- VectorVest OnLine
- VectorVest Options Analyzer
- VectorVest ProGraphics v6.0
- VectorVest ProTrader 7
- VectorVest RealTime Derby Tool
- VectorVest Simulator
- VectorVest Variator
- VectorVest Watchdog
