HOT TOPICS LIST
- MACD
- Fibonacci
- RSI
- Gann
- ADXR
- Stochastics
- Volume
- Triangles
- Futures
- Cycles
- Volatility
- ZIGZAG
- MESA
- Retracement
- Aroon
INDICATORS LIST
LIST OF TOPICS
PRINT THIS ARTICLE
by Billy Williams
Certain momentum stocks like Netflix stand out from others, and a lot can be learned from their price moves.
Position: Sell
Billy Williams
Billy Williams has been trading the markets for 27 years, specializing in momentum trading with stocks and options.
PRINT THIS ARTICLE
STOCKS
NFLX Trade Analysis
10/21/11 10:56:25 AMby Billy Williams
Certain momentum stocks like Netflix stand out from others, and a lot can be learned from their price moves.
Position: Sell
| Every once in a while, a stock leader emerges that not only takes the market higher but manages to become a stunning symbol of momentum trading with all the profit potential that it implies. Netflix (NFLX) was such a stock and a dominant force in digital entertainment that it left much of the video rental giants scrambling for second place. Netflix offered the ultimate in convenience and selection by offering consumers the choice of choosing DVDs from its online rental site and then mailing it to the customer along with a return-mail slip for a small monthly membership fee. This simple model formed a formidable competitive edge over its brick-and-mortars rivals that led to former industry leaders Blockbuster Video losing market share and Hollywood Video closing its doors. |

|
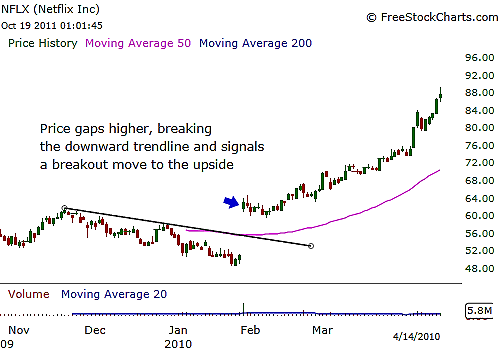
| FIGURE 1: NFLX. NFLX broke out higher on a huge gap entry in late January 2010. Price surged upward with barely a hesitation. |
| Graphic provided by: www.freestockcharts.com. |
| |
| Later, Netflix increased its lead by offering streaming video through computers, which later was made accessible through a cottage industry offering ancillary products that allowed Netflix to later stream videos on demand through TVs. Sales for Netflix grew exponentially as memberships were "sticky" enough to retain current customers while gaining new ones. The compounding effect was reflected in Netflix stock as the share price increased and trading volume swelled higher as new investors and traders alike jumped on board. On January 28, 2010, NFLX gapped up and broke out into a bullish trend, gathering steam from a potential price point of $62 and running up to $125 as little as six months later, almost doubling in price. See Figures 1 and 2. |

|
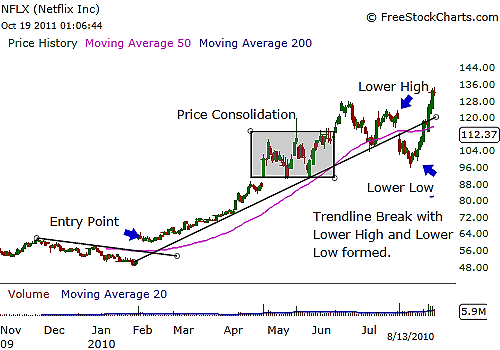
| FIGURE 2: NFLX. Six months later, price entered a period of price consolidation in June that same year but traded higher before forming a trend reversal. After making a higher high in its price action, NFLX failed to follow through signaling an exit. Later, NFLX recovered and traded higher, offering a second entry point on its next bull run. |
| Graphic provided by: www.freestockcharts.com. |
| |
| NFLX went on to experience a mild price reversal that would have stopped any reasonable trader out, but then a second entry was offered on August 12, 2010, at around $128. Again, price catapulted higher and continued its bullish trend up to a close of $255 on April 25, 2011, before entering a period of price consolidation. Consolidation periods can be tricky for an inexperienced trader, but if you have the right skill set and approach, you could sit comfortably until the bulls or bears take control of the trend. In this case, price did break its trendline but did not make lower highs and lower lows, revealing that price was stable. Later, on May 25, 2011, price resumed its bullish trend and went on to make new higher highs and higher lows. This was, however, short-lived. |

|
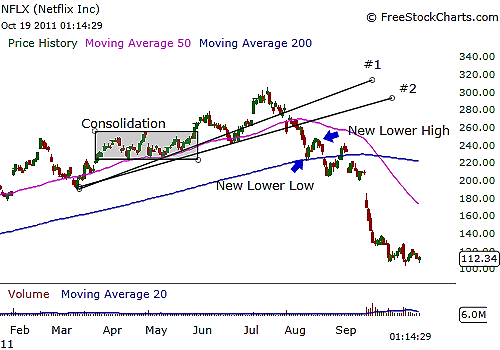
| FIGURE 3: NFLX. At point 1, price broke its upward trendline during a period of price consolidation but never made a lower high or lower low to confirm a price reversal. Later, price recovered and resumed its bullish trend. but at trendline point 2, price failed to follow after trading through that trendline. A price reversal formed and was followed by a bearish trend. |
| Graphic provided by: www.freestockcharts.com. |
| |
| On July 26, 2011, price broke through the upward trendline followed by a lower high set on August 12, 2011. This breaking of the trendline with a failure on the part of price to make a higher high confirmed a price reversal and a possible new trend emerging. If you had held on to your entire position from the second entry of $128 to this signal to exit at around $221, your profit potential would have been $93 points a share or just under 73%. However, just as NFLX's price action signaled an exit, it also indicated the potential for a new trend to emerge. See Figure 3. |
| Bearish trends have incredible velocity to the downside and can be over before you see that they have even begun. That said, price offered two relatively easy entries as it broke through its 200-day simple moving average (SMA) and pulled back on August 31, 2011, and September 7, 2011. In either case, you could have shorted the stock itself or bought put options for a directional move to the downside. Blow-by-blow accounts allow you to gain an understanding on how other traders see the market and read price in real-time. More important, what you should take away from this is that price reveals more to a skilled trader than any news report or tip from a market professional. NFLX's gains were the result of rising sales and improved fundamentals, but that was all reflected in the price action before anyone else in the news media reported it. If you are hearing what a good investment a stock is in the news, online, or in a periodical, then it is typically too late for you to profit by it. The key lesson for you is to think for yourself once you have a working skill set to find trades like these before anyone else does. |
Billy Williams has been trading the markets for 27 years, specializing in momentum trading with stocks and options.
| Company: | StockOptionSystem.com |
| E-mail address: | stockoptionsystem.com@gmail.com |
Traders' Resource Links | |
| StockOptionSystem.com has not added any product or service information to TRADERS' RESOURCE. | |
Click here for more information about our publications!
Comments

|

Request Information From Our Sponsors
- StockCharts.com, Inc.
- Candle Patterns
- Candlestick Charting Explained
- Intermarket Technical Analysis
- John Murphy on Chart Analysis
- John Murphy's Chart Pattern Recognition
- John Murphy's Market Message
- MurphyExplainsMarketAnalysis-Intermarket Analysis
- MurphyExplainsMarketAnalysis-Visual Analysis
- StockCharts.com
- Technical Analysis of the Financial Markets
- The Visual Investor
- VectorVest, Inc.
- Executive Premier Workshop
- One-Day Options Course
- OptionsPro
- Retirement Income Workshop
- Sure-Fire Trading Systems (VectorVest, Inc.)
- Trading as a Business Workshop
- VectorVest 7 EOD
- VectorVest 7 RealTime/IntraDay
- VectorVest AutoTester
- VectorVest Educational Services
- VectorVest OnLine
- VectorVest Options Analyzer
- VectorVest ProGraphics v6.0
- VectorVest ProTrader 7
- VectorVest RealTime Derby Tool
- VectorVest Simulator
- VectorVest Variator
- VectorVest Watchdog
