HOT TOPICS LIST
- MACD
- Fibonacci
- RSI
- Gann
- ADXR
- Stochastics
- Volume
- Triangles
- Futures
- Cycles
- Volatility
- ZIGZAG
- MESA
- Retracement
- Aroon
INDICATORS LIST
LIST OF TOPICS
PRINT THIS ARTICLE
by Donald W. Pendergast, Jr.
After a long and trying selloff, shares of First Solar appear to be at or near a major turning point.
Position: Accumulate
Donald W. Pendergast, Jr.
Donald W. Pendergast is a financial markets consultant who offers specialized services to stock brokers and high net worth individuals who seek a better bottom line for their portfolios.
PRINT THIS ARTICLE
CHART ANALYSIS
Is The Selling Over For First Solar?
10/20/11 09:00:36 AMby Donald W. Pendergast, Jr.
After a long and trying selloff, shares of First Solar appear to be at or near a major turning point.
Position: Accumulate
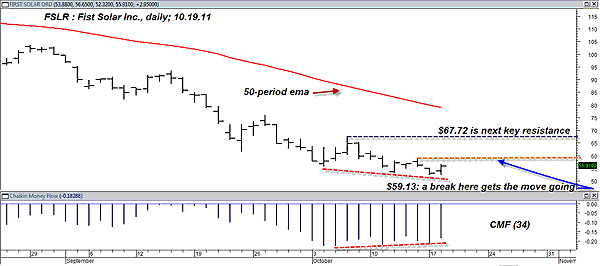
| At certain times, it pays to keep a watchful eye on stocks that have endured a prolonged selloff, taking special note of those that have begun to manifest signs of positive price/money flow divergence. First Solar, Inc. (FSLR), certainly looks to be a real contender in this category of "unloved but hopeful" stocks, and sharp traders might want to consider putting on small positions now in anticipation of a modest rally higher over the next few months. Here's a closer look at a few details of import to value-conscious investors and traders now. |

|
| FIGURE 1: FIRST SOLAR, DAILY. It takes a while to turn an ocean liner around, but if the captain and crew know what they're doing, the job can be done more quickly. In this case the captain is FSLR and the crew is the stocks making up the broad market. |
| Graphic provided by: MetaStock. |
| |
| To start, the stock has positive long-term earnings growth expectations going forward, making such an extended selloff appear to be overdone, particularly on its daily chart (Figure 1). Second, the stock's medium-term money flow (based on the 34-period Chaikin money flow [CMF][34] histogram) has recently taken a bullish turn, starting to rise even as the stock drifted a bit lower over the past two weeks. On FSLR's daily chart, note the next minor resistance (dashed gold line) at $59.13; a daily close above this line is likely to cause a surge of new buying in this issue, which could set the stage for a fairly quick follow-through move (with a few shakeouts along the way) up to major resistance at $67.72. As long as the broad market continues to maintain a bullish posture, this daily setup in FSLR looks solid, especially for those interested in covered-call setups or even a scale-in strategy. |
| Using a pyramid strategy, you might want to buy 50 shares at $56, 40 at $58, 30 at $60, 20 at $62, and 10 at $64, calculating a stop-loss point on the entire position that risks no more than 2% of your entire account's value. You can even create a spreadsheet that can help you play with the numbers, should you decide to go this route with FSLR. |
| The solar energy business apparently still has a future, and despite periodic shakeouts in the industry and the shares of its companies, there may still be plenty of money to be made in this sector of the stock market. |
Donald W. Pendergast is a financial markets consultant who offers specialized services to stock brokers and high net worth individuals who seek a better bottom line for their portfolios.
| Title: | Writer, market consultant |
| Company: | Linear Trading Systems LLC |
| Jacksonville, FL 32217 | |
| Phone # for sales: | 904-239-9564 |
| E-mail address: | lineartradingsys@gmail.com |
Traders' Resource Links | |
| Linear Trading Systems LLC has not added any product or service information to TRADERS' RESOURCE. | |
Click here for more information about our publications!
PRINT THIS ARTICLE

Request Information From Our Sponsors
- StockCharts.com, Inc.
- Candle Patterns
- Candlestick Charting Explained
- Intermarket Technical Analysis
- John Murphy on Chart Analysis
- John Murphy's Chart Pattern Recognition
- John Murphy's Market Message
- MurphyExplainsMarketAnalysis-Intermarket Analysis
- MurphyExplainsMarketAnalysis-Visual Analysis
- StockCharts.com
- Technical Analysis of the Financial Markets
- The Visual Investor
- VectorVest, Inc.
- Executive Premier Workshop
- One-Day Options Course
- OptionsPro
- Retirement Income Workshop
- Sure-Fire Trading Systems (VectorVest, Inc.)
- Trading as a Business Workshop
- VectorVest 7 EOD
- VectorVest 7 RealTime/IntraDay
- VectorVest AutoTester
- VectorVest Educational Services
- VectorVest OnLine
- VectorVest Options Analyzer
- VectorVest ProGraphics v6.0
- VectorVest ProTrader 7
- VectorVest RealTime Derby Tool
- VectorVest Simulator
- VectorVest Variator
- VectorVest Watchdog
