HOT TOPICS LIST
- MACD
- Fibonacci
- RSI
- Gann
- ADXR
- Stochastics
- Volume
- Triangles
- Futures
- Cycles
- Volatility
- ZIGZAG
- MESA
- Retracement
- Aroon
INDICATORS LIST
LIST OF TOPICS
PRINT THIS ARTICLE
by Koos van der Merwe
The saying is, "When America sneezes, the world catches a cold," but considering the current worldwide turmoil, is this still true?
Position: Accumulate
Koos van der Merwe
Has been a technical analyst since 1969, and has worked as a futures and options trader with First Financial Futures in Johannesburg, South Africa.
PRINT THIS ARTICLE
ELLIOTT WAVE
When America Sneezes, Does The World Still Catch Cold?
10/19/11 01:11:14 PMby Koos van der Merwe
The saying is, "When America sneezes, the world catches a cold," but considering the current worldwide turmoil, is this still true?
Position: Accumulate
| Economist Nouriel Roubini recently said that the US has a 60% chance of a recession. About a month ago, that was an 80% chance. We watch the world economy react to a Greek default, and shiver when Portugal, Italy, and Ireland are mentioned in the next breath. We listen to German chancellor Angela Merkel sneeze, and watch the world economy shiver, and the Dow Jones Industrial Average (DJIA) fall 200 points. But isn't that wrong? Isn't the United States the world economic leader? Recently, China announced that its economic growth is slowing, and the DJIA dropped 50 points. But that doesn't sound right, either. Does it mean that the US will export less to China, or it does it mean that the world is buying less from China? In any case, somebody please pass the US a tissue. |

|
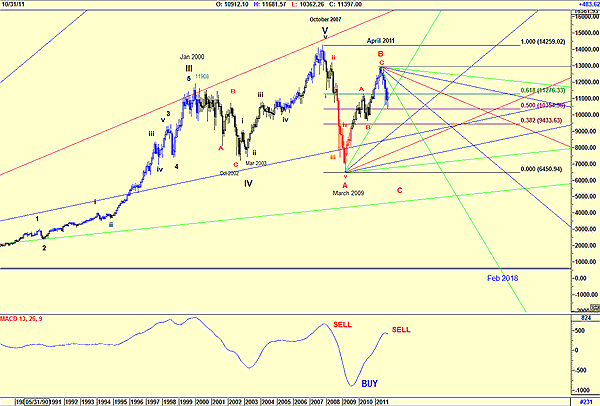
| FIGURE 1: DJIA, MONTHLY |
| Graphic provided by: AdvancedGET. |
| |
| My monthly chart of the DJIA (Figure 1), let's face it, does look extremely bearish. With wave V topping out in October 2007, with wave A bottoming in March 2009, and wave B topping in April 2011, we would then expect wave C to now fall in a five-wave correction. At the moment, wave C has corrected off the 50% retracement level of wave B, which means that the market should correct upward. This will be followed by a wave 3 of wave C down, justifying those bears out there, and the possibility of a recession. This is confirmed by the moving average convergence/divergence (MACD), which has given a major sell signal. However... |

|
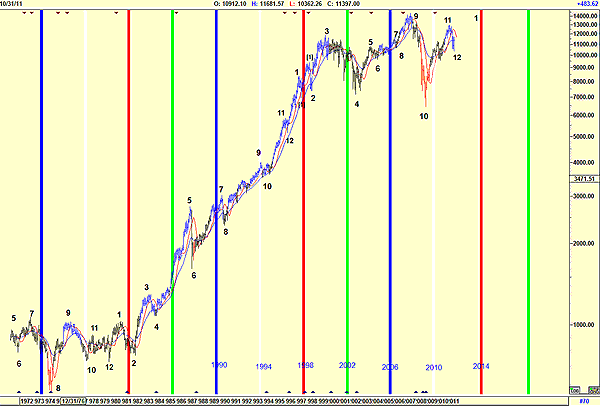
| FIGURE 2: PAGET'S CYCLICAL COUNT OF DJIA, MONTHLY |
| Graphic provided by: AdvancedGET. |
| |
| Paget's cyclical count is suggesting that the DJIA will rise into 2014 (Figure 2). A closer look at the chart suggests that the down move may not be complete, and that we could see further downside. The killer to the bear theory, on the other hand, is the Standard & Poor's 500. |

|
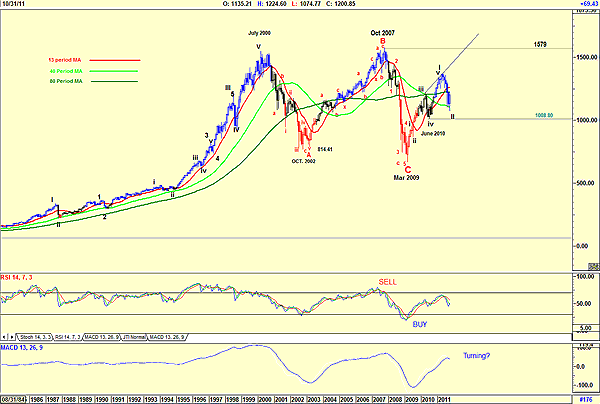
| FIGURE 3: S&P 500, MONTHLY |
| Graphic provided by: AdvancedGET. |
| |
| The monthly S&P 500 (Figure 3) shows that the ABC correction is complete, and that the index is completing a wave 2 of a new bull market that started in March 2009. The index appears to be trading between the 40- and 80-period moving averages. Note that the relative strength index (RSI) is still moving upward and has not given a sell signal. Note also that the MACD has given a sell signal but could be turning positive. When we look at the charts, we can see why the bears are out there. This suggests that in their analysis, they are confining themselves to the top stops, rather than looking at the market as a whole. This indecision should last until November 2012, until after the US Presidential election, unless all those countries in Europe and Asia somehow prevent the US from sneezing all over them. |
Has been a technical analyst since 1969, and has worked as a futures and options trader with First Financial Futures in Johannesburg, South Africa.
| Address: | 3256 West 24th Ave |
| Vancouver, BC | |
| Phone # for sales: | 6042634214 |
| E-mail address: | petroosp@gmail.com |
Click here for more information about our publications!
PRINT THIS ARTICLE

Request Information From Our Sponsors
- StockCharts.com, Inc.
- Candle Patterns
- Candlestick Charting Explained
- Intermarket Technical Analysis
- John Murphy on Chart Analysis
- John Murphy's Chart Pattern Recognition
- John Murphy's Market Message
- MurphyExplainsMarketAnalysis-Intermarket Analysis
- MurphyExplainsMarketAnalysis-Visual Analysis
- StockCharts.com
- Technical Analysis of the Financial Markets
- The Visual Investor
- VectorVest, Inc.
- Executive Premier Workshop
- One-Day Options Course
- OptionsPro
- Retirement Income Workshop
- Sure-Fire Trading Systems (VectorVest, Inc.)
- Trading as a Business Workshop
- VectorVest 7 EOD
- VectorVest 7 RealTime/IntraDay
- VectorVest AutoTester
- VectorVest Educational Services
- VectorVest OnLine
- VectorVest Options Analyzer
- VectorVest ProGraphics v6.0
- VectorVest ProTrader 7
- VectorVest RealTime Derby Tool
- VectorVest Simulator
- VectorVest Variator
- VectorVest Watchdog
