HOT TOPICS LIST
- MACD
- Fibonacci
- RSI
- Gann
- ADXR
- Stochastics
- Volume
- Triangles
- Futures
- Cycles
- Volatility
- ZIGZAG
- MESA
- Retracement
- Aroon
INDICATORS LIST
LIST OF TOPICS
PRINT THIS ARTICLE
by Mike Carr, CMT
Rate of change in the S&P 500 shows strength in two time frames.
Position: Buy
Mike Carr, CMT
Mike Carr, CMT, is a member of the Market Technicians Association, and editor of the MTA's newsletter, Technically Speaking. He is also the author of "Smarter Investing in Any Economy: The Definitive Guide to Relative Strength Investing," and "Conquering the Divide: How to Use Economic Indicators to Catch Stock Market Trends."
PRINT THIS ARTICLE
RATE OF CHANGE
S&P 500 Momentum Is Bullish
10/18/11 09:08:34 AMby Mike Carr, CMT
Rate of change in the S&P 500 shows strength in two time frames.
Position: Buy
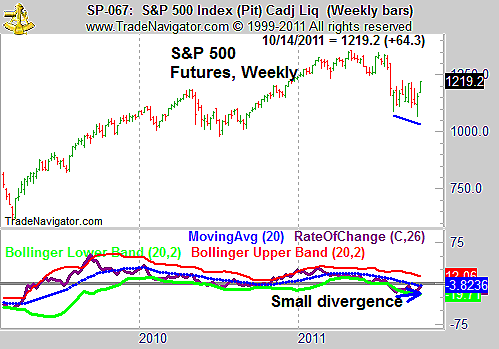
| The Standard & Poor's 500 fell sharply during the summer months, and investors wondered if it were the start of a new bear market. The time for that concern has probably passed, and the decline was deep enough to be classified as a bear market by most. Since the worst of the decline, which lasted about three weeks, volatility has been high but prices haven't made much progress in either direction. On the weekly chart (Figure 1), price action doesn't show a clear trend. |

|
| FIGURE 1: S&P 500, WEEKLY. Weekly prices in the S&P 500 show a wide-ranging pattern forming after the decline. |
| Graphic provided by: Trade Navigator. |
| |
| On that time frame, momentum has shown a small bullish divergence. The 26-week rate of change (ROC) failed to confirm the price lows in the S&P 500. While the divergence was small, it could be significant, given the strong bearish sentiment that exists in the market. |
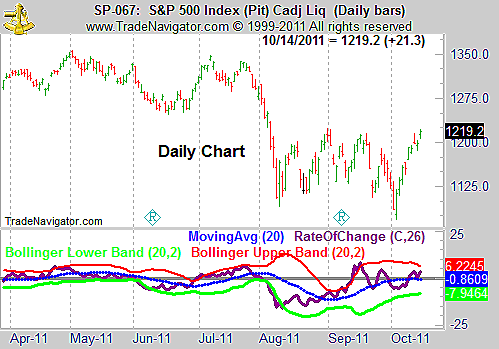
| The daily chart (Figure 2) shows that the divergence is even more pronounced in the shorter time frame. ROC has also turned positive on that chart, and crosses above and below zero often indicate trend changes in the index. In this case, a bullish trend could be starting. |

|
| FIGURE 2: S&P 500, DAILY. On the daily chart of the S&P 500, the ROC divergence is much easier to spot. |
| Graphic provided by: Trade Navigator. |
| |
| Other momentum indicators have shown a similar divergence formation as prices hit a new low. With sentiment being so negative, these divergences are worth noting. The S&P 500 is in a seasonably favorable time and more likely to challenge new highs to set a new low before the end of the year. |
Mike Carr, CMT, is a member of the Market Technicians Association, and editor of the MTA's newsletter, Technically Speaking. He is also the author of "Smarter Investing in Any Economy: The Definitive Guide to Relative Strength Investing," and "Conquering the Divide: How to Use Economic Indicators to Catch Stock Market Trends."
| Website: | www.moneynews.com/blogs/MichaelCarr/id-73 |
| E-mail address: | marketstrategist@gmail.com |
Click here for more information about our publications!
PRINT THIS ARTICLE

|

Request Information From Our Sponsors
- StockCharts.com, Inc.
- Candle Patterns
- Candlestick Charting Explained
- Intermarket Technical Analysis
- John Murphy on Chart Analysis
- John Murphy's Chart Pattern Recognition
- John Murphy's Market Message
- MurphyExplainsMarketAnalysis-Intermarket Analysis
- MurphyExplainsMarketAnalysis-Visual Analysis
- StockCharts.com
- Technical Analysis of the Financial Markets
- The Visual Investor
- VectorVest, Inc.
- Executive Premier Workshop
- One-Day Options Course
- OptionsPro
- Retirement Income Workshop
- Sure-Fire Trading Systems (VectorVest, Inc.)
- Trading as a Business Workshop
- VectorVest 7 EOD
- VectorVest 7 RealTime/IntraDay
- VectorVest AutoTester
- VectorVest Educational Services
- VectorVest OnLine
- VectorVest Options Analyzer
- VectorVest ProGraphics v6.0
- VectorVest ProTrader 7
- VectorVest RealTime Derby Tool
- VectorVest Simulator
- VectorVest Variator
- VectorVest Watchdog
