HOT TOPICS LIST
- MACD
- Fibonacci
- RSI
- Gann
- ADXR
- Stochastics
- Volume
- Triangles
- Futures
- Cycles
- Volatility
- ZIGZAG
- MESA
- Retracement
- Aroon
INDICATORS LIST
LIST OF TOPICS
PRINT THIS ARTICLE
by Donald W. Pendergast, Jr.
Every market finds an enduring bottom at some point. Here's one way to help identify the start of a new bull market.
Position: N/A
Donald W. Pendergast, Jr.
Donald W. Pendergast is a financial markets consultant who offers specialized services to stock brokers and high net worth individuals who seek a better bottom line for their portfolios.
PRINT THIS ARTICLE
MOVING AVERAGES
R2K On The Way To 200-Day EMA?
10/18/11 11:11:53 AMby Donald W. Pendergast, Jr.
Every market finds an enduring bottom at some point. Here's one way to help identify the start of a new bull market.
Position: N/A
| It's been quite a ride for equity (not to mention commodity) market investors since mid-summer 2011, what with the panicked selloff action in July and August and then the back & forth indecisiveness of September and October on top of that. However, now that all of the broad market indexes (.SPX, .NDX, .RUT) have finally closed above their respective 50-day exponential moving averages (EMAs), the market equation is slowly starting to shift toward the bullish side of the equation. Here's a brief look at the current technical setup in the Russell 2000 index (.RUT). |

|
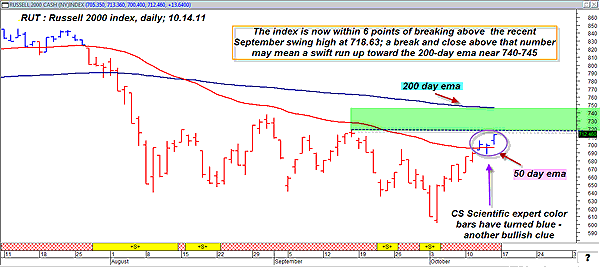
| FIGURE 1: .RUT, DAILY. While even the best-looking market setups can fail, it still pays to be prepared with a list of high relative strength stocks firing buy signals should the .RUT soon take out September's high of 718.63. |
| Graphic provided by: MetaStock. |
| Graphic provided by: CS Scientific Expert Advisor from MetaStock 11. |
| |
| One of the first things a technician would notice on Figure 1 is, as previously mentioned, the daily close of the .RUT above its 50-day EMA (the 50-day is at 696.89) and that the daily price bars have turned from red to blue, as interpreted by the CS Scientific Hybrid trade screen in MetaStock 11. Market forces are apparently going to at least try to make a run at the widely anticipated year-end (seasonal) rally, and that the .RUT is now only six points away from meeting and/or exceeding September's swing high of 718.63, giving bullish traders a few extra reasons to load up on high momentum, high relative strength stocks ahead of such a possible move higher. The green shaded area on the chart is an area in which to expect a rapid price rise, especially if the September swing high is taken out on a daily close -- preferably sooner rather than later. A potential runup to the 200-day EMA will also bring both moving averages into closer proximity, helping pave the way for a possible golden cross (where the 50-day EMA crosses above the 200-day, a major signal for big institutions to go long the market) -- something that the bulls have long been waiting for. Bulls should be busy preparing their short list of quality stocks -- stocks with good earnings potential and a high 13-week relative strength ranking versus the broad market. |
| Stay tuned, as the final two weeks of October should prove to be exciting indeed. |
Donald W. Pendergast is a financial markets consultant who offers specialized services to stock brokers and high net worth individuals who seek a better bottom line for their portfolios.
| Title: | Writer, market consultant |
| Company: | Linear Trading Systems LLC |
| Jacksonville, FL 32217 | |
| Phone # for sales: | 904-239-9564 |
| E-mail address: | lineartradingsys@gmail.com |
Traders' Resource Links | |
| Linear Trading Systems LLC has not added any product or service information to TRADERS' RESOURCE. | |
Click here for more information about our publications!
PRINT THIS ARTICLE

Request Information From Our Sponsors
- StockCharts.com, Inc.
- Candle Patterns
- Candlestick Charting Explained
- Intermarket Technical Analysis
- John Murphy on Chart Analysis
- John Murphy's Chart Pattern Recognition
- John Murphy's Market Message
- MurphyExplainsMarketAnalysis-Intermarket Analysis
- MurphyExplainsMarketAnalysis-Visual Analysis
- StockCharts.com
- Technical Analysis of the Financial Markets
- The Visual Investor
- VectorVest, Inc.
- Executive Premier Workshop
- One-Day Options Course
- OptionsPro
- Retirement Income Workshop
- Sure-Fire Trading Systems (VectorVest, Inc.)
- Trading as a Business Workshop
- VectorVest 7 EOD
- VectorVest 7 RealTime/IntraDay
- VectorVest AutoTester
- VectorVest Educational Services
- VectorVest OnLine
- VectorVest Options Analyzer
- VectorVest ProGraphics v6.0
- VectorVest ProTrader 7
- VectorVest RealTime Derby Tool
- VectorVest Simulator
- VectorVest Variator
- VectorVest Watchdog
