HOT TOPICS LIST
- MACD
- Fibonacci
- RSI
- Gann
- ADXR
- Stochastics
- Volume
- Triangles
- Futures
- Cycles
- Volatility
- ZIGZAG
- MESA
- Retracement
- Aroon
INDICATORS LIST
LIST OF TOPICS
PRINT THIS ARTICLE
by Gary Grosschadl
Is the Nasdaq in a trading range with bullish upside or will it possibly succumb to a potentially bearish broadening formation?
Position: N/A
Gary Grosschadl
Independent Canadian equities trader and technical analyst based in Peterborough
Ontario, Canada.
PRINT THIS ARTICLE
BROADENING FORMATION
The Nasdaq's Broadening Bottom Formation
05/02/02 11:27:24 AMby Gary Grosschadl
Is the Nasdaq in a trading range with bullish upside or will it possibly succumb to a potentially bearish broadening formation?
Position: N/A
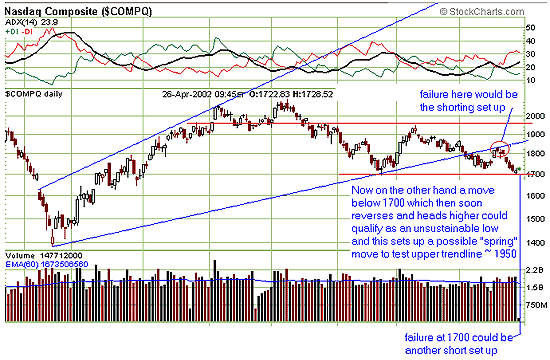
| Depending on how you draw your trendlines an argument can be made for a bearish broadening formation in the Nasdaq. Inside this pattern is an obvious trading range between 1700 - 1950. |
| A movement breaking out of the trading range either way can be significant and subsequent action should be carefully watched. With the market action the past two days, we have a move below the trading range and this will have bearish implications unless we see a sudden reversal to the upside. If we get that upside reversal we have a possible "spring" set up which implies a move back up to test the upper channel trendline around the 1950 area. In a previous article I suggested a spring set up for the VIX which inferred a possible downward move of at least 200 points, which occurred. |

|
| The bigger picture shows a broadening formation which is potentially bearish. The smaller picture shows a trading range between 1700 - 1950. |
| Graphic provided by: stockcharts.com. |
| |
| If this downward move continues then we have to consider the bearish implications of the broadening formation. The rather large distance between the top and bottom trendlines of the broadening formation suggests that the Nasdaq could go down to 1400 or lower, thereby satisfying those bears that maintain a lower bottom retest. |
| In general, the Nasdaq and tech stocks are still mired in volatile times. It behooves traders to keep looking both ways before crossing the street! |
Independent Canadian equities trader and technical analyst based in Peterborough
Ontario, Canada.
| Website: | www.whatsonsale.ca/financial.html |
| E-mail address: | gwg7@sympatico.ca |
Click here for more information about our publications!
Comments
Date: 05/03/02Rank: 4Comment:
Date: 05/06/02Rank: 5Comment:
Date: 05/07/02Rank: 4Comment:
Date: 05/07/02Rank: 4Comment: I have heard these remarks made many times about trading ranges, and when falling outside of them is ok as long as they return. What is considered to be allowable in regards to a move outside the trading range and also the time period? If you could address this in terms of % move and # of days, outside the range it would be appreciated. Thanks. stschannen@cfl.rr.com
Date: 05/07/02Rank: 5Comment:
Date: 05/20/02Rank: 5Comment:

Request Information From Our Sponsors
- StockCharts.com, Inc.
- Candle Patterns
- Candlestick Charting Explained
- Intermarket Technical Analysis
- John Murphy on Chart Analysis
- John Murphy's Chart Pattern Recognition
- John Murphy's Market Message
- MurphyExplainsMarketAnalysis-Intermarket Analysis
- MurphyExplainsMarketAnalysis-Visual Analysis
- StockCharts.com
- Technical Analysis of the Financial Markets
- The Visual Investor
- VectorVest, Inc.
- Executive Premier Workshop
- One-Day Options Course
- OptionsPro
- Retirement Income Workshop
- Sure-Fire Trading Systems (VectorVest, Inc.)
- Trading as a Business Workshop
- VectorVest 7 EOD
- VectorVest 7 RealTime/IntraDay
- VectorVest AutoTester
- VectorVest Educational Services
- VectorVest OnLine
- VectorVest Options Analyzer
- VectorVest ProGraphics v6.0
- VectorVest ProTrader 7
- VectorVest RealTime Derby Tool
- VectorVest Simulator
- VectorVest Variator
- VectorVest Watchdog
