HOT TOPICS LIST
- MACD
- Fibonacci
- RSI
- Gann
- ADXR
- Stochastics
- Volume
- Triangles
- Futures
- Cycles
- Volatility
- ZIGZAG
- MESA
- Retracement
- Aroon
INDICATORS LIST
LIST OF TOPICS
PRINT THIS ARTICLE
by Koos van der Merwe
Telus has formed a symmetrical triangle.
Position: Buy
Koos van der Merwe
Has been a technical analyst since 1969, and has worked as a futures and options trader with First Financial Futures in Johannesburg, South Africa.
PRINT THIS ARTICLE
TRIANGLES
Telus A Buy?
10/17/11 10:06:43 AMby Koos van der Merwe
Telus has formed a symmetrical triangle.
Position: Buy
| A symmetrical triangle is formed by a succession of price fluctuations, each of which is smaller than its predecessor. By definition it must have at least four reversal points. From the final point, a breakout may occur at any time. More powerful moves are found when prices break out decisively at a point somewhere between half and three-quarters of the distance between the left side of the triangle and the apex. Do note that that they are not as reliable as a head & shoulders pattern because of false breakouts, but they can be used reliably to suggest a target price once a breakout is confirmed and maintained. However, one must watch the apex, because reversals could occur at that point. |

|
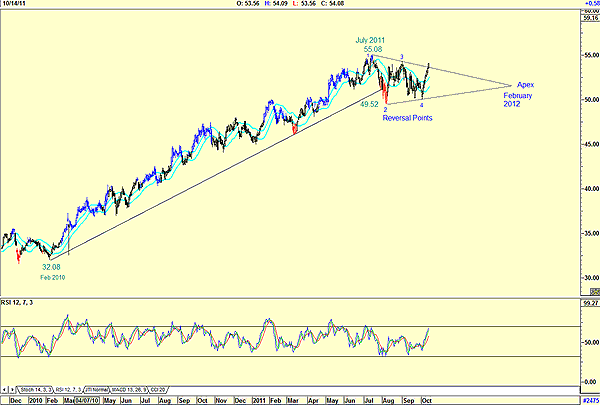
| FIGURE 1: TELUS, MONTHLY. Telus is showing that a triangle has formed. |
| Graphic provided by: AdvancedGET. |
| |
| Figure 1 is a chart of Telus listed on the Toronto Stock Exchange. The chart shows how the price has risen strongly from a low of $32.08 on February 2010 to a high of $55.08 by July 2011. From that point, the price has moved sideways in a triangle formation and has broken out after showing four reversal points. The apex of the triangle is February 2012, which means that we could expect the price to rise until that date. The target high suggested is $72.52 (55.08 - 32.08 = 23 + 49.52 = 72.52). Of course, there will be corrections along the way, but with a target price that is 42.53% above today's price of $54.08, the share is definitely worth a buy. |
Has been a technical analyst since 1969, and has worked as a futures and options trader with First Financial Futures in Johannesburg, South Africa.
| Address: | 3256 West 24th Ave |
| Vancouver, BC | |
| Phone # for sales: | 6042634214 |
| E-mail address: | petroosp@gmail.com |
Click here for more information about our publications!
Comments

Request Information From Our Sponsors
- StockCharts.com, Inc.
- Candle Patterns
- Candlestick Charting Explained
- Intermarket Technical Analysis
- John Murphy on Chart Analysis
- John Murphy's Chart Pattern Recognition
- John Murphy's Market Message
- MurphyExplainsMarketAnalysis-Intermarket Analysis
- MurphyExplainsMarketAnalysis-Visual Analysis
- StockCharts.com
- Technical Analysis of the Financial Markets
- The Visual Investor
- VectorVest, Inc.
- Executive Premier Workshop
- One-Day Options Course
- OptionsPro
- Retirement Income Workshop
- Sure-Fire Trading Systems (VectorVest, Inc.)
- Trading as a Business Workshop
- VectorVest 7 EOD
- VectorVest 7 RealTime/IntraDay
- VectorVest AutoTester
- VectorVest Educational Services
- VectorVest OnLine
- VectorVest Options Analyzer
- VectorVest ProGraphics v6.0
- VectorVest ProTrader 7
- VectorVest RealTime Derby Tool
- VectorVest Simulator
- VectorVest Variator
- VectorVest Watchdog
