

HOT TOPICS LIST
- MACD
- Fibonacci
- RSI
- Gann
- ADXR
- Stochastics
- Volume
- Triangles
- Futures
- Cycles
- Volatility
- ZIGZAG
- MESA
- Retracement
- Aroon
INDICATORS LIST
LIST OF TOPICS
PRINT THIS ARTICLE
by Mike Carr, CMT
Higher oil prices would also be a signal that the economic recovery is still intact.
Position: Buy
Mike Carr, CMT
Mike Carr, CMT, is a member of the Market Technicians Association, and editor of the MTA's newsletter, Technically Speaking. He is also the author of "Smarter Investing in Any Economy: The Definitive Guide to Relative Strength Investing," and "Conquering the Divide: How to Use Economic Indicators to Catch Stock Market Trends."
PRINT THIS ARTICLE
CHART ANALYSIS
Oil Turns Bullish
10/14/11 11:53:34 AMby Mike Carr, CMT
Higher oil prices would also be a signal that the economic recovery is still intact.
Position: Buy
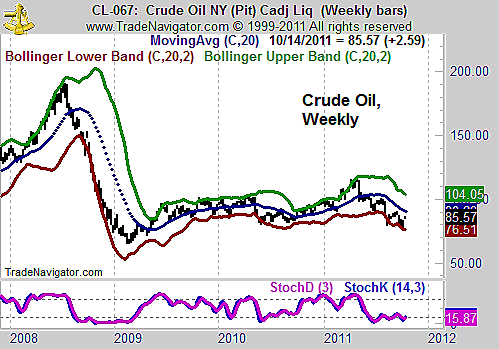
| Demand for oil is highly correlated with the level of economic activity. At higher levels of global GDP growth, oil moves up. Oil is needed to fuel both the factories that produce the goods and the transport system to bring goods to markets. Even high-tech devices require a large amount of oil, and Internet servers require oil at some stage of the power generation process so they can operate. Oil prices peaked in the summer of 2008 and although off their lows, are more than 50% below the all-time highs (Figure 1). |
|
| FIGURE 1: OIL, WEEKLY. Weekly oil prices show signs of a bottom. |
| Graphic provided by: Trade Navigator. |
| |
| On the weekly chart, stochastics gave a buy signal, and the recent price low offered a small bullish divergence by remaining within the lower Bollinger Band. Oil has become deeply oversold and a rebound would not be a surprise to traders. Stochastic signals work best in a market that is oversold or overbought. |
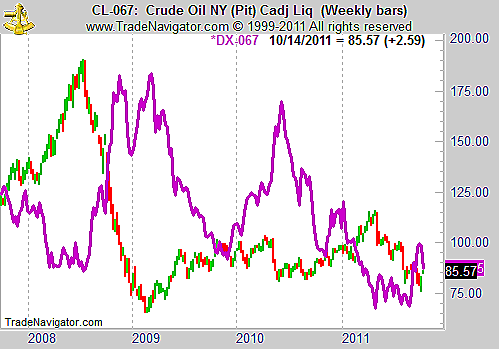
| While oil prices are positively correlated with economic activity, they show a strong negative correlation to the US dollar (Figure 2). There are certainly fundamental reasons for this relationship, but the chart makes it easy to see them. Traders can benefit without knowing why an economic relationship exists. In this case, the chart shows that the dollar rally seems to be short-lived and a top can be seen in the chart. |
|
| FIGURE 2: OIL, WEEKLY. A top in the US dollar is visible and that would signal higher oil prices. |
| Graphic provided by: Trade Navigator. |
| |
| With stochastics and intermarket relationships pointing toward higher prices, a long position in oil is a trade with limited risk. The futures contract is shown in these charts, but OIL, an exchange traded fund based on oil, is also on a buy signal. |
Mike Carr, CMT, is a member of the Market Technicians Association, and editor of the MTA's newsletter, Technically Speaking. He is also the author of "Smarter Investing in Any Economy: The Definitive Guide to Relative Strength Investing," and "Conquering the Divide: How to Use Economic Indicators to Catch Stock Market Trends."
| Website: | www.moneynews.com/blogs/MichaelCarr/id-73 |
| E-mail address: | marketstrategist@gmail.com |
Click here for more information about our publications!
PRINT THIS ARTICLE

Request Information From Our Sponsors
- StockCharts.com, Inc.
- Candle Patterns
- Candlestick Charting Explained
- Intermarket Technical Analysis
- John Murphy on Chart Analysis
- John Murphy's Chart Pattern Recognition
- John Murphy's Market Message
- MurphyExplainsMarketAnalysis-Intermarket Analysis
- MurphyExplainsMarketAnalysis-Visual Analysis
- StockCharts.com
- Technical Analysis of the Financial Markets
- The Visual Investor
- VectorVest, Inc.
- Executive Premier Workshop
- One-Day Options Course
- OptionsPro
- Retirement Income Workshop
- Sure-Fire Trading Systems (VectorVest, Inc.)
- Trading as a Business Workshop
- VectorVest 7 EOD
- VectorVest 7 RealTime/IntraDay
- VectorVest AutoTester
- VectorVest Educational Services
- VectorVest OnLine
- VectorVest Options Analyzer
- VectorVest ProGraphics v6.0
- VectorVest ProTrader 7
- VectorVest RealTime Derby Tool
- VectorVest Simulator
- VectorVest Variator
- VectorVest Watchdog