HOT TOPICS LIST
- MACD
- Fibonacci
- RSI
- Gann
- ADXR
- Stochastics
- Volume
- Triangles
- Futures
- Cycles
- Volatility
- ZIGZAG
- MESA
- Retracement
- Aroon
INDICATORS LIST
LIST OF TOPICS
PRINT THIS ARTICLE
by Donald W. Pendergast, Jr.
A stock that continues to make new highs is probably doing so for a very good reason.
Position: N/A
Donald W. Pendergast, Jr.
Donald W. Pendergast is a financial markets consultant who offers specialized services to stock brokers and high net worth individuals who seek a better bottom line for their portfolios.
PRINT THIS ARTICLE
CHART ANALYSIS
Another New High For Kimberly Clark
10/14/11 11:40:05 AMby Donald W. Pendergast, Jr.
A stock that continues to make new highs is probably doing so for a very good reason.
Position: N/A
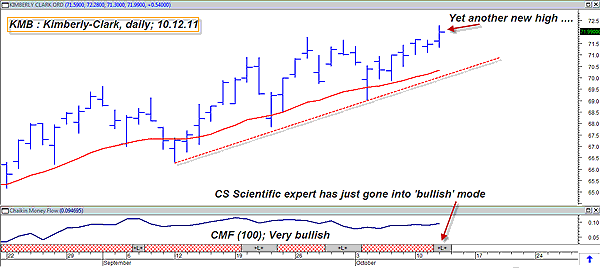
| Shares of Kimberly Clark (KMB) are ensconced in a very strong and enduring uptrend (see Figure 1) and show little sign of impending exhaustion. Here's a closer look now at this important consumer staples stock. |

|
| FIGURE 1: KMB, DAILY. Why argue with a freight train, anyway? Shares of KMB keep on chugging higher, little by little, at least for now. A near-term covered-call play here looks very inviting. |
| Graphic provided by: MetaStock. |
| Graphic provided by: CS Scientific Expert Advisor from MetaStock 11. |
| |
| To locate this particular stock, all I did was load the Deel new-highs exploration in MetaStock with the Standard & Poor's 500 component stock list and then simply let it rip. In about 20 seconds, a list of nine stocks was generated, of whick KMB was one. After overlaying its daily chart with the CS Scientific Hybrid Trade screen (a MetaStock 11 Expert Advisor), I was further intrigued by the fact that the expert had just flashed a "+L+" (gray ribbon at bottom of chart) signal, confirming that a strong, strong uptrend was now in effect. Given that the long-term Chaikin money flow (CMF)(100) is still bullish, it only seems natural to gravitate toward the covered-call side of the trading world when considering trading KMB from the long side here. As you look at the chart, notice the red exponential moving average (a 21-day EMA); this line in the sand can serve as a very effective initial and/or trailing stop-loss for the entire position -- if you get a daily close below it, just close out the entire position (I sell the stock and buy back the short call) either at a profit or a loss and then wait for another good trade setup. |
| The broad market may be nearing a temporary pause (or even a minor pullback), seeing as how it's been grinding steadily higher since October 4, 2011, but such a backpedaling move may only be temporary before more significant upside is seen. So take it day by day and try to locate the strongest relative strength stocks issuing buy signals from proven trading systems before deploying your cash back into this market. The broad market is nearing a critical phase, one that will soon determine if the rally has more room to run -- or is running on borrowed time instead. Which will it be? Stay tuned to find out! |
Donald W. Pendergast is a financial markets consultant who offers specialized services to stock brokers and high net worth individuals who seek a better bottom line for their portfolios.
| Title: | Writer, market consultant |
| Company: | Linear Trading Systems LLC |
| Jacksonville, FL 32217 | |
| Phone # for sales: | 904-239-9564 |
| E-mail address: | lineartradingsys@gmail.com |
Traders' Resource Links | |
| Linear Trading Systems LLC has not added any product or service information to TRADERS' RESOURCE. | |
Click here for more information about our publications!
PRINT THIS ARTICLE

Request Information From Our Sponsors
- StockCharts.com, Inc.
- Candle Patterns
- Candlestick Charting Explained
- Intermarket Technical Analysis
- John Murphy on Chart Analysis
- John Murphy's Chart Pattern Recognition
- John Murphy's Market Message
- MurphyExplainsMarketAnalysis-Intermarket Analysis
- MurphyExplainsMarketAnalysis-Visual Analysis
- StockCharts.com
- Technical Analysis of the Financial Markets
- The Visual Investor
- VectorVest, Inc.
- Executive Premier Workshop
- One-Day Options Course
- OptionsPro
- Retirement Income Workshop
- Sure-Fire Trading Systems (VectorVest, Inc.)
- Trading as a Business Workshop
- VectorVest 7 EOD
- VectorVest 7 RealTime/IntraDay
- VectorVest AutoTester
- VectorVest Educational Services
- VectorVest OnLine
- VectorVest Options Analyzer
- VectorVest ProGraphics v6.0
- VectorVest ProTrader 7
- VectorVest RealTime Derby Tool
- VectorVest Simulator
- VectorVest Variator
- VectorVest Watchdog
