HOT TOPICS LIST
- MACD
- Fibonacci
- RSI
- Gann
- ADXR
- Stochastics
- Volume
- Triangles
- Futures
- Cycles
- Volatility
- ZIGZAG
- MESA
- Retracement
- Aroon
INDICATORS LIST
LIST OF TOPICS
PRINT THIS ARTICLE
by Chaitali Mohile
The ascending rally of the yen has moved into a very narrow range. The indicators are likely to trigger a reversal rally.
Position: Sell
Chaitali Mohile
Active trader in the Indian stock markets since 2003 and a full-time writer. Trading is largely based upon technical analysis.
PRINT THIS ARTICLE
WEDGE FORMATIONS
Yen In Narrow Range
10/14/11 11:32:59 AMby Chaitali Mohile
The ascending rally of the yen has moved into a very narrow range. The indicators are likely to trigger a reversal rally.
Position: Sell
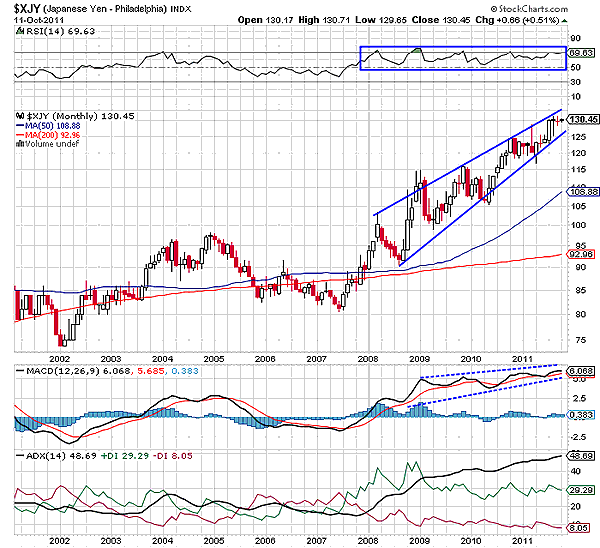
| The Japanese Yen Index ($XJY) initiated a bullish rally in 2008 with the support of the two moving averages (MAs). Due to robust support of the 200-day and 50-day MAs, the index saw tremendous bullish force at the early stage. A fresh long-term uptrend was developed on the monthly time frame in Figure 1. The average directional index (ADX) (14) traveled upward with huge buying pressure indicated by the positive directional index (+DI). In addition, the momentum indicator -- the moving average convergence/divergence (MACD) (12,26,9) -- turned positive after a bullish crossover in negative territory. Gradually, the momentum oscillator surged into positive territory above the zero line. Both indicators confirmed the rally except the relative strength index (RSI) (14) in Figure 1. We can see that the RSI (14) was stuck in the bullish range between 50 and 60 levels. The ranging indicator highlighted a negative divergence as price was rallying upward. |

|
| FIGURE 1: $XJY, MONTHLY |
| Graphic provided by: StockCharts.com. |
| |
| As a result, $XJY began moving in a narrow range, forming a rising wedge on the monthly time frame. The RSI (14) continued its sideways movement and an overheated uptrend surged in the highly overheated regions above 40 levels. However, the MACD (12,26,9) began flirting with the trigger line, indicating an upcoming volatility in the rally. The index has reached a new high at 130.42 levels in the considerably narrow range. |
| The rising wedge in Figure 1 is about to mature as both trendlines have converged, indicating the possibility of a bearish breakout for $XJY. However, traders need to watch for the confirmed bearish breakout. The indicators have to change their directions for the confirmed breakdown. Although the uptrend is overheated, either the ADX has to descend or the selling pressure (red line) has to surge with rapid force to drag the price below the lower trendline of the wedge. |
| The range-bound RSI (14) would further narrow the price range, resulting in the breakout possibility. Therefore, the rising wedge of $XJY would continue its journey within the two converging trendlines. The bearish breakout would add pressure on the Japanese economy; therefore, the potential breakout is likely to be moderate. During this breakout, the equity market should also be observed carefully as it would open many trading opportunities. |
Active trader in the Indian stock markets since 2003 and a full-time writer. Trading is largely based upon technical analysis.
| Company: | Independent |
| Address: | C1/3 Parth Indraprasth Towers. Vastrapur |
| Ahmedabad, Guj 380015 | |
| E-mail address: | chaitalimohile@yahoo.co.in |
Traders' Resource Links | |
| Independent has not added any product or service information to TRADERS' RESOURCE. | |
Click here for more information about our publications!
PRINT THIS ARTICLE

Request Information From Our Sponsors
- VectorVest, Inc.
- Executive Premier Workshop
- One-Day Options Course
- OptionsPro
- Retirement Income Workshop
- Sure-Fire Trading Systems (VectorVest, Inc.)
- Trading as a Business Workshop
- VectorVest 7 EOD
- VectorVest 7 RealTime/IntraDay
- VectorVest AutoTester
- VectorVest Educational Services
- VectorVest OnLine
- VectorVest Options Analyzer
- VectorVest ProGraphics v6.0
- VectorVest ProTrader 7
- VectorVest RealTime Derby Tool
- VectorVest Simulator
- VectorVest Variator
- VectorVest Watchdog
- StockCharts.com, Inc.
- Candle Patterns
- Candlestick Charting Explained
- Intermarket Technical Analysis
- John Murphy on Chart Analysis
- John Murphy's Chart Pattern Recognition
- John Murphy's Market Message
- MurphyExplainsMarketAnalysis-Intermarket Analysis
- MurphyExplainsMarketAnalysis-Visual Analysis
- StockCharts.com
- Technical Analysis of the Financial Markets
- The Visual Investor
