HOT TOPICS LIST
- MACD
- Fibonacci
- RSI
- Gann
- ADXR
- Stochastics
- Volume
- Triangles
- Futures
- Cycles
- Volatility
- ZIGZAG
- MESA
- Retracement
- Aroon
INDICATORS LIST
LIST OF TOPICS
PRINT THIS ARTICLE
by Billy Williams
Traders have an edge in the market, and if they know how to use two indicators to short stocks during a downward move, they can make explosive profits.
Position: Hold
Billy Williams
Billy Williams has been trading the markets for 27 years, specializing in momentum trading with stocks and options.
PRINT THIS ARTICLE
STRATEGIES
A Short Setup When Giants Trip
10/13/11 07:48:25 AMby Billy Williams
Traders have an edge in the market, and if they know how to use two indicators to short stocks during a downward move, they can make explosive profits.
Position: Hold
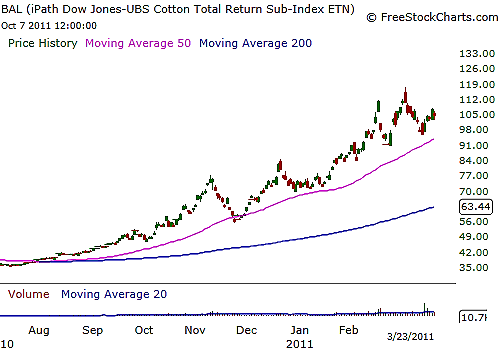
| In today's market, the edge has shifted from investors to traders because since early 2000, when the dotcom crash occurred, the stock market has basically been in a gigantic trading range. Given that the market has been rallying between support and resistance within a long-term consolidation period, the edge goes to traders in this market environment, as they have the technical skills to recognize when it is time to go long. Currently, the market is experiencing a strong period of weakness where short sellers are the strong hand, but shorting stocks is not a game for most traders, even if they are experienced. The reason is that most short sellers don't understand the erratic movement of price when the bears take control, because a downward move can be sudden if not terrifying to most traders who are caught flat-footed as the market crashes. When this occurs, however, you can make a lot of money quickly due to the frightening freefall that price can exhibit during a crash. See Figure 1. |

|
| FIGURE 1: BAL. The ETF had a huge runup during most of 2010 and 2011 before weakness began to enter its trend. |
| Graphic provided by: www.freestockcharts.com. |
| |
| To short these downward moves with precision, you need the overall market to be headed lower or at least consolidating during periods of weakness right after the market has gone through a strong uptrend. It is within this period of price consolidation or decline that there is fertile ground for strong short candidates to make themselves known and be picked off with sniper-like accuracy. But you need an approach to take advantage when the former stock leaders or giant companies begin to see their stock price stumble. It is when the giants of the market begin to trip up that you can step in and ride the momentum downward. |

|
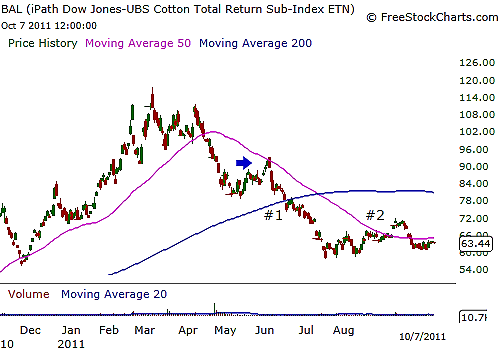
| FIGURE 2: BAL. Price began to falter at the beginning of second-quarter 2011 and broke through the 50-day SMA where it retraced slightly, signaling a short setup. Profits were taken at the 200-day SMA and then a trailing stop was in effect as the 50-day SMA crossed below the 200 SMA before the second profit was signaled and the remaining position exited. |
| Graphic provided by: www.freestockcharts.com. |
| |
| The 50-day simple moving average (SMA) and 200-day SMA are two main indicators that are closely tracked and followed by both small traders and large institutions. See Figure 2. Stocks that have been trading above these two moving averages but then experience weakness when they trade below one or both of the SMAs can result in a steady selloff to a mass exodus on anyone who has a position in that stock. When a stock trades below the 50-day SMA, it is the equivalent of price breaking price support because so many traders observe the relation of price to that SMA that they will use it as a stop point or a position to buy more shares. It is because of this conflict between buyers and sellers that price will typically retrace after falling through the SMA but then trade downward sharply. |
| When this occurs, you want to short during the pullback and sell half the position at the 200-day SMA while using a trailing stop. The 50-day SMA can act as that trailing stop on the condition that you only use it as such when it crosses downward through the 200-day SMA before you use it. Make sure you keep a close watch on volume to confirm that price is making a strong break through the SMA in order to confirm that it is following through to the downside. Likewise, if price breaks through the 200-day SMA, wait for it to retrace while tracking volume to confirm a surge in trading volume as price plunges lower. Then use the 50-day SMA as a trailing stop. |
Billy Williams has been trading the markets for 27 years, specializing in momentum trading with stocks and options.
| Company: | StockOptionSystem.com |
| E-mail address: | stockoptionsystem.com@gmail.com |
Traders' Resource Links | |
| StockOptionSystem.com has not added any product or service information to TRADERS' RESOURCE. | |
Click here for more information about our publications!
PRINT THIS ARTICLE

|

Request Information From Our Sponsors
- StockCharts.com, Inc.
- Candle Patterns
- Candlestick Charting Explained
- Intermarket Technical Analysis
- John Murphy on Chart Analysis
- John Murphy's Chart Pattern Recognition
- John Murphy's Market Message
- MurphyExplainsMarketAnalysis-Intermarket Analysis
- MurphyExplainsMarketAnalysis-Visual Analysis
- StockCharts.com
- Technical Analysis of the Financial Markets
- The Visual Investor
- VectorVest, Inc.
- Executive Premier Workshop
- One-Day Options Course
- OptionsPro
- Retirement Income Workshop
- Sure-Fire Trading Systems (VectorVest, Inc.)
- Trading as a Business Workshop
- VectorVest 7 EOD
- VectorVest 7 RealTime/IntraDay
- VectorVest AutoTester
- VectorVest Educational Services
- VectorVest OnLine
- VectorVest Options Analyzer
- VectorVest ProGraphics v6.0
- VectorVest ProTrader 7
- VectorVest RealTime Derby Tool
- VectorVest Simulator
- VectorVest Variator
- VectorVest Watchdog
