HOT TOPICS LIST
- MACD
- Fibonacci
- RSI
- Gann
- ADXR
- Stochastics
- Volume
- Triangles
- Futures
- Cycles
- Volatility
- ZIGZAG
- MESA
- Retracement
- Aroon
INDICATORS LIST
LIST OF TOPICS
PRINT THIS ARTICLE
by Donald W. Pendergast, Jr.
With the broad market seemingly in the midst of a substantial turn to the upside, shares of IBM appear poised to help lead it even higher.
Position: N/A
Donald W. Pendergast, Jr.
Donald W. Pendergast is a financial markets consultant who offers specialized services to stock brokers and high net worth individuals who seek a better bottom line for their portfolios.
PRINT THIS ARTICLE
CHART ANALYSIS
IBM Mega-Momentum
10/12/11 12:18:56 PMby Donald W. Pendergast, Jr.
With the broad market seemingly in the midst of a substantial turn to the upside, shares of IBM appear poised to help lead it even higher.
Position: N/A
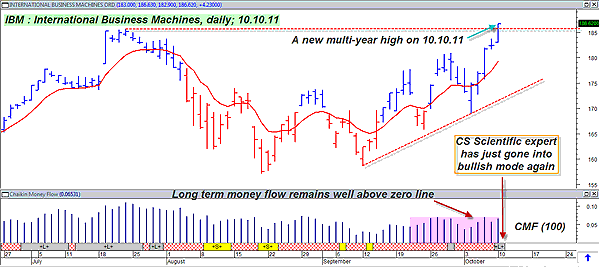
| To anyone who came of age in the 1950s, 1960s, 1970s, and 1980s, the name IBM was as much a part of everyday American business as anything, what with IBM mainframes forming the backbone of most corporate data processing centers. The company has evolved and adapted to the needs of a changing society over the years and remains a player in the world of large-cap stocks. Here's a look at the exceptionally bullish daily chart for this tech giant's stock (Figure 1). |

|
| FIGURE 1: IBM, DAILY. Buy a new high? Well, yes, maybe it is the right thing to do if the overall backdrop in the broad market is exceptionally bullish -- like right now. |
| Graphic provided by: MetaStock. |
| Graphic provided by: CS Scientific Expert Advisor from MetaStock 11. |
| |
| This is a relatively simple chart setup to analyze, so here goes: 1. The entire stock market (large and small cap) is making a strong reversal to the upside. 2. Shares of IBM have just made a fresh multiyear high. 3. The stock has strong long-term money flow (CMF)(100). 4. The CS Scientific Hybrid trade screen has once again issued a "+L+" signal, indicating a very strong uptrend in motion. Given all of this, it would probably be wise to capitalize on IBM's massive momentum, realizing that a stock that makes new highs attracts the big money (mutual funds) that is needed to propel an equity to substantially higher price levels. |
| Buying a near-term (one to two months of time value) covered call looks to be one of the more rational ways to play IBM here. You can use the daily chart's 21-period exponential moving average (EMA) as both an initial and trailing stop on the entire position -- a daily close below the EMA would be your signal to close out the entire deal, either at a profit or a loss, no questions asked. Always check the bid-ask spread whenever you decide to include options in your trading arsenal, whether it's a covered-call setup or not. Every bit helps when it comes to the sometimes arduous task of extracting profits from the stock market, so learn to put every possible advantage to work for your trading operation. |
Donald W. Pendergast is a financial markets consultant who offers specialized services to stock brokers and high net worth individuals who seek a better bottom line for their portfolios.
| Title: | Writer, market consultant |
| Company: | Linear Trading Systems LLC |
| Jacksonville, FL 32217 | |
| Phone # for sales: | 904-239-9564 |
| E-mail address: | lineartradingsys@gmail.com |
Traders' Resource Links | |
| Linear Trading Systems LLC has not added any product or service information to TRADERS' RESOURCE. | |
Click here for more information about our publications!
PRINT THIS ARTICLE

Request Information From Our Sponsors
- StockCharts.com, Inc.
- Candle Patterns
- Candlestick Charting Explained
- Intermarket Technical Analysis
- John Murphy on Chart Analysis
- John Murphy's Chart Pattern Recognition
- John Murphy's Market Message
- MurphyExplainsMarketAnalysis-Intermarket Analysis
- MurphyExplainsMarketAnalysis-Visual Analysis
- StockCharts.com
- Technical Analysis of the Financial Markets
- The Visual Investor
- VectorVest, Inc.
- Executive Premier Workshop
- One-Day Options Course
- OptionsPro
- Retirement Income Workshop
- Sure-Fire Trading Systems (VectorVest, Inc.)
- Trading as a Business Workshop
- VectorVest 7 EOD
- VectorVest 7 RealTime/IntraDay
- VectorVest AutoTester
- VectorVest Educational Services
- VectorVest OnLine
- VectorVest Options Analyzer
- VectorVest ProGraphics v6.0
- VectorVest ProTrader 7
- VectorVest RealTime Derby Tool
- VectorVest Simulator
- VectorVest Variator
- VectorVest Watchdog
