HOT TOPICS LIST
- MACD
- Fibonacci
- RSI
- Gann
- ADXR
- Stochastics
- Volume
- Triangles
- Futures
- Cycles
- Volatility
- ZIGZAG
- MESA
- Retracement
- Aroon
INDICATORS LIST
LIST OF TOPICS
PRINT THIS ARTICLE
by Koos van der Merwe
Banks throughout the world have been hit hard. Is it time to start buying shares in some of them?
Position: Accumulate
Koos van der Merwe
Has been a technical analyst since 1969, and has worked as a futures and options trader with First Financial Futures in Johannesburg, South Africa.
PRINT THIS ARTICLE
HEAD & SHOULDERS
Time To Buy Barclays Bank?
10/12/11 08:32:36 AMby Koos van der Merwe
Banks throughout the world have been hit hard. Is it time to start buying shares in some of them?
Position: Accumulate
| Banks in the US earned the anger of the public by accepting a bailout from the government, and then paying generous bonuses to their CEOs and managers. In Europe and especially in England, things were slightly different, as seen by the Royal Bank of Scotland (RBS). The British government has become the majority shareholder of RBS in exchange for a handout. Barclays Bank, however, kept its independence by not accepting a handout. However, the company did raise cash by selling its exchange traded funds (ETF) business, cutting its dividend payment, raising cash through outside investors, and streamlining its operation and becoming more productive. In September 2011 Barclays chief executive officer Robert Diamond said that the bank was back on track to meet its target of achieving 13% return of equity by 2013. |

|
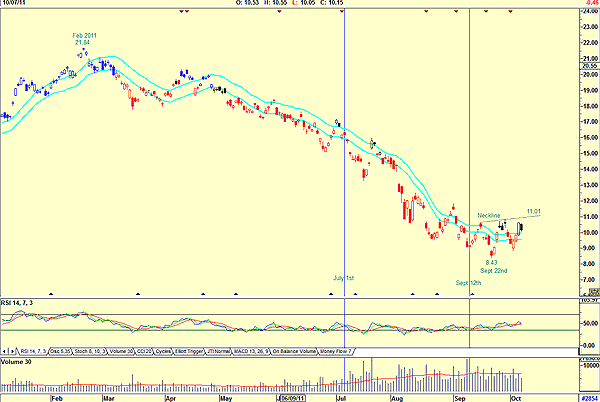
| FIGURE 1: BARCLAYS BANK, DAILY. This chart of Barclays Bank shows its downward trajectory. |
| Graphic provided by: AdvancedGET. |
| |
| Figure 1, a daily chart of the share, shows how the price fell from a high of $21.84 in February 2011 to a low of $8.43 by September 22. Note how volume increased from July 1 as the share price started to fall strongly, a sign of weakness. However, from September 12, the pattern reversed. Volume increased as the price rose and fell as the price fell, suggesting strength. This was in line with the relative strength index (RSI), which started rising above the 32 horizontal line after hugging it. The share price appears to be forming an inverse head & shoulders. |

|
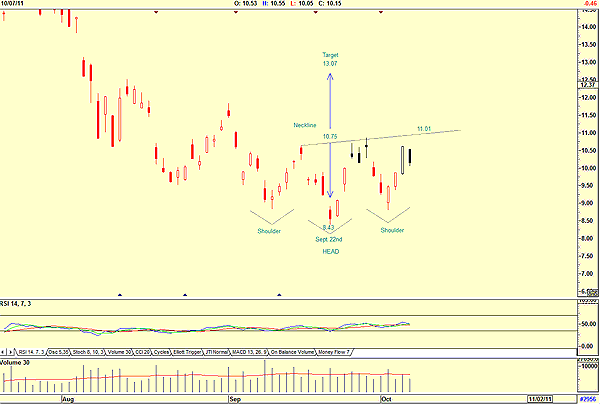
| FIGURE 2: INVERTED H&S |
| Graphic provided by: AdvancedGET. |
| |
| Figure 2 shows the inverted H&S formation, suggesting a target of $13.07 should the price break above the neckline at $11.01. The share should be placed on your watchlist but only purchased once it breaks above $11.01. |
Has been a technical analyst since 1969, and has worked as a futures and options trader with First Financial Futures in Johannesburg, South Africa.
| Address: | 3256 West 24th Ave |
| Vancouver, BC | |
| Phone # for sales: | 6042634214 |
| E-mail address: | petroosp@gmail.com |
Click here for more information about our publications!
PRINT THIS ARTICLE

Request Information From Our Sponsors
- StockCharts.com, Inc.
- Candle Patterns
- Candlestick Charting Explained
- Intermarket Technical Analysis
- John Murphy on Chart Analysis
- John Murphy's Chart Pattern Recognition
- John Murphy's Market Message
- MurphyExplainsMarketAnalysis-Intermarket Analysis
- MurphyExplainsMarketAnalysis-Visual Analysis
- StockCharts.com
- Technical Analysis of the Financial Markets
- The Visual Investor
- VectorVest, Inc.
- Executive Premier Workshop
- One-Day Options Course
- OptionsPro
- Retirement Income Workshop
- Sure-Fire Trading Systems (VectorVest, Inc.)
- Trading as a Business Workshop
- VectorVest 7 EOD
- VectorVest 7 RealTime/IntraDay
- VectorVest AutoTester
- VectorVest Educational Services
- VectorVest OnLine
- VectorVest Options Analyzer
- VectorVest ProGraphics v6.0
- VectorVest ProTrader 7
- VectorVest RealTime Derby Tool
- VectorVest Simulator
- VectorVest Variator
- VectorVest Watchdog
