HOT TOPICS LIST
- MACD
- Fibonacci
- RSI
- Gann
- ADXR
- Stochastics
- Volume
- Triangles
- Futures
- Cycles
- Volatility
- ZIGZAG
- MESA
- Retracement
- Aroon
INDICATORS LIST
LIST OF TOPICS
PRINT THIS ARTICLE
by Chaitali Mohile
Weight Watchers International has reached its make-or-break point.
Position: N/A
Chaitali Mohile
Active trader in the Indian stock markets since 2003 and a full-time writer. Trading is largely based upon technical analysis.
PRINT THIS ARTICLE
SUPPORT & RESISTANCE
Weight Watchers Under Bearish Pressure
10/11/11 10:51:24 AMby Chaitali Mohile
Weight Watchers International has reached its make-or-break point.
Position: N/A
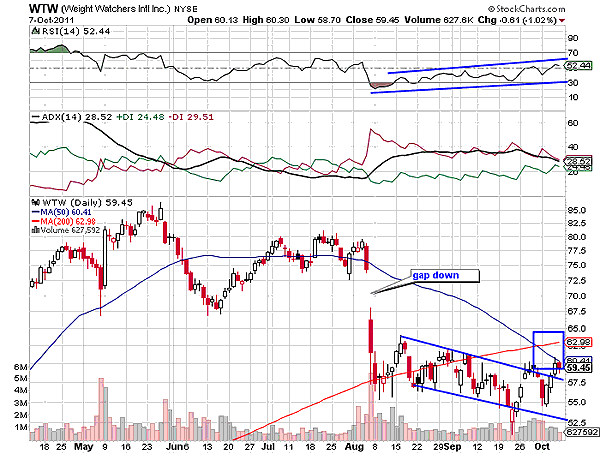
| Weight Watchers Intl. (WTW) breached its 50-day moving average (MA) support with a huge gap down, retracing toward the next support of the 200-day moving average (MA). This long-term MA failed to extend robust support to the bearish rally (Figure 1). WTW plunged even below the 200-day MA, forming an intermediate descending channel. Meanwhile, the two MAs converged and developed a bearish moving average crossover on the daily time frame. The upper trendline resistance of the channel was breached in the second attempt, but the bullish breakout could not surge. The 50-day MA was declining indicating that price movement was still in a bearish direction. The reversed price rally is likely to move within the descending range of the channel. However, if the stock manages to sustain above the upper trendline support, the next 200-day MA resistance could restrict the bullish breakout. |

|
| FIGURE 1: WTW, DAILY. The stock has formed an intermediate descending channel. |
| Graphic provided by: StockCharts.com. |
| |
| During the bearish price rally, the relative strength index (RSI) (14) in Figure 1 was surging at a slower pace from an oversold region. Although the indicator has reached the bullish area above the 50 level, it lacks the essential strength to pull the stock. The indicator is struggling to establish support at the center line; the average directional index (ADX) (14) is showing significant strength in a developing downtrend for the past two months. Gradually, the bearish trend developed with stable selling pressure. In such conditions, WTW could not breach the MA resistance, and therefore, the gap formed in August would not be filled immediately. However, sooner or later the gap would get filled, as none of the gaps remain unfilled. WTW would regain its bullish strength after establishing support at the 200-day MA. A quick short trade can be triggered if the stock plunges below the upper trendline. Later, if the descending channel is broken downward, then the short trade can be continued with the stop-loss at the breakout point. |

|
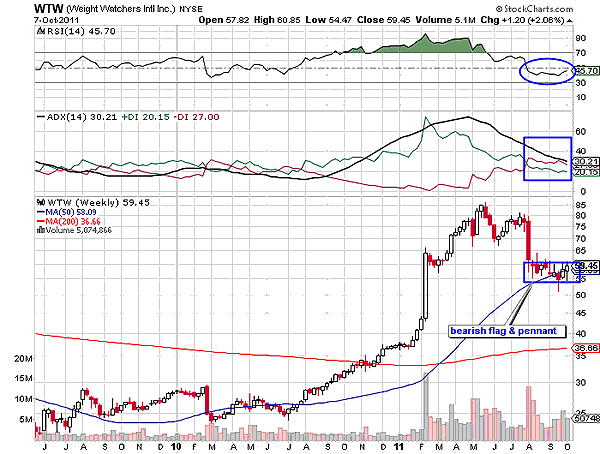
| FIGURE 2: WTW, WEEKLY. The bearish flag & pennant is formed with the 50-day MA support. |
| Graphic provided by: StockCharts.com. |
| |
| WTW has been consolidating at its previous support-resistance levels. Earlier in March 2011, the stock moved sideways in a very narrow range before breaking upward. This formed a support level for the current bearish rally. The 50-day MA is another strong support for WTW. The range-bound price rally in Figure 2 has formed a bearish flag & pennant formation. An overheated uptrend has reversed, developing a fresh downtrend for WTW. Therefore, the bearish flag & pennant formation is confirmed as a bearish continuation pattern. The RSI (14) in Figure 2 (see the marked circle) is trying to climb the center line for gaining bullish strength. |
| Hence, traders should stay watchful at the current levels before initiating any future trades. The bearish flag & pennant would break downward if the 50-day MA support is violated, bringing WTW to another low. |
Active trader in the Indian stock markets since 2003 and a full-time writer. Trading is largely based upon technical analysis.
| Company: | Independent |
| Address: | C1/3 Parth Indraprasth Towers. Vastrapur |
| Ahmedabad, Guj 380015 | |
| E-mail address: | chaitalimohile@yahoo.co.in |
Traders' Resource Links | |
| Independent has not added any product or service information to TRADERS' RESOURCE. | |
Click here for more information about our publications!
PRINT THIS ARTICLE

|

Request Information From Our Sponsors
- StockCharts.com, Inc.
- Candle Patterns
- Candlestick Charting Explained
- Intermarket Technical Analysis
- John Murphy on Chart Analysis
- John Murphy's Chart Pattern Recognition
- John Murphy's Market Message
- MurphyExplainsMarketAnalysis-Intermarket Analysis
- MurphyExplainsMarketAnalysis-Visual Analysis
- StockCharts.com
- Technical Analysis of the Financial Markets
- The Visual Investor
- VectorVest, Inc.
- Executive Premier Workshop
- One-Day Options Course
- OptionsPro
- Retirement Income Workshop
- Sure-Fire Trading Systems (VectorVest, Inc.)
- Trading as a Business Workshop
- VectorVest 7 EOD
- VectorVest 7 RealTime/IntraDay
- VectorVest AutoTester
- VectorVest Educational Services
- VectorVest OnLine
- VectorVest Options Analyzer
- VectorVest ProGraphics v6.0
- VectorVest ProTrader 7
- VectorVest RealTime Derby Tool
- VectorVest Simulator
- VectorVest Variator
- VectorVest Watchdog
