HOT TOPICS LIST
- MACD
- Fibonacci
- RSI
- Gann
- ADXR
- Stochastics
- Volume
- Triangles
- Futures
- Cycles
- Volatility
- ZIGZAG
- MESA
- Retracement
- Aroon
INDICATORS LIST
LIST OF TOPICS
PRINT THIS ARTICLE
by Donald W. Pendergast, Jr.
Stocks that may be ready to break above a significant, longstanding swing high are worthy of further evaluation. As you check them out, make sure you also check its long-term money flow.
Position: N/A
Donald W. Pendergast, Jr.
Donald W. Pendergast is a financial markets consultant who offers specialized services to stock brokers and high net worth individuals who seek a better bottom line for their portfolios.
PRINT THIS ARTICLE
DOUBLE TOPS
American Tower Worth A Look?
10/11/11 08:54:52 AMby Donald W. Pendergast, Jr.
Stocks that may be ready to break above a significant, longstanding swing high are worthy of further evaluation. As you check them out, make sure you also check its long-term money flow.
Position: N/A
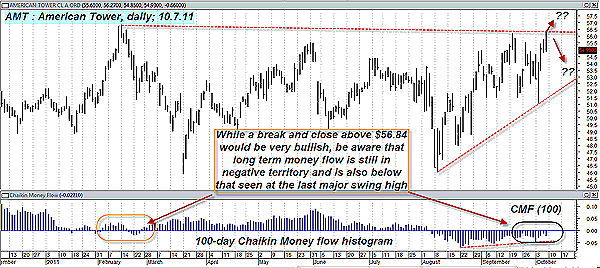
| Shares of American Tower (AMT) appear to be in prime position to make a near-term assault on the upper resistance line connecting three notable swing highs made during the course of 2011. Will this setup play out successfully -- moving to new highs -- or will it stall, stumble, and fall, keeping the stock mired in a long-term congestion pattern? Here's a look now (Figure 1). |

|
| FIGURE 1: AMT, DAILY. When analyzing long-term money flow, always check to see which side of the zero line the current histogram reading is, and then check to see if significant price/money flow divergences exist. Money flow is an important technical tool, so ignore it at your own risk. |
| Graphic provided by: MetaStock. |
| |
| AMT shares have been stuck in a $10-wide congestion zone for about a year now, and while there have been more than enough tradable swing moves for serious market participants to profit from, it's been a disappointing stock for those more inclined to rely on trend-following methods. Most moves in the stock have been in the $3 to $4 range, hardly enough to make a hard-core trend-follower take a second look. Meanwhile, AMT's long-term money flow (based on the 100-day Chaikin money flow [CMF][100]) is stuck in decidedly bearish territory (below its zero line), and its recent money flow histogram peak was actually lower than that seen at the last major swing high in the stock, made back in early 2011. This is known in trader's terminology as a "bearish price/money flow divergence" and is frequently a heads-up to astute traders to be aware that the smart money may be gradually withdrawing its support from the stock as they progressively transfer more of it to the "dumb money" interests in the market. However, most traders who've survived long enough to avoid getting wiped out (or who did get wiped at at some time in the past, me included) or who actually did recover from serious account blowout issues will freely admit that trying to predict which way a breakout is going is a fool's errand, and that you're much better off waiting on the market to tip its hand before committing to a stock market position. |
| With this chart setup, we will simply wait for a breakout and daily close above the resistance line/previous high at $56.84 before considering deploying cash into a long position in AMT, or we will wait for a failed breakout attempt and subsequent pullback befoe considering a short trade in the stock. Of course, we will only use a proven trading system to generate our entry signals, no matter which of those scenarios actually plays out in the days and weeks ahead. Letting the market show you what its most probable intentions are is one of the best ways to avoid the sin of overtrading, or stock market prediction. Wait on the market and you will be miles ahead of those who are always trying to outsmart it -- and who always, absolutely, and without fail end up wiping out substantial amounts of their trading capital. Wise up and learn to wait on the market! |
Donald W. Pendergast is a financial markets consultant who offers specialized services to stock brokers and high net worth individuals who seek a better bottom line for their portfolios.
| Title: | Writer, market consultant |
| Company: | Linear Trading Systems LLC |
| Jacksonville, FL 32217 | |
| Phone # for sales: | 904-239-9564 |
| E-mail address: | lineartradingsys@gmail.com |
Traders' Resource Links | |
| Linear Trading Systems LLC has not added any product or service information to TRADERS' RESOURCE. | |
Click here for more information about our publications!
PRINT THIS ARTICLE

Request Information From Our Sponsors
- StockCharts.com, Inc.
- Candle Patterns
- Candlestick Charting Explained
- Intermarket Technical Analysis
- John Murphy on Chart Analysis
- John Murphy's Chart Pattern Recognition
- John Murphy's Market Message
- MurphyExplainsMarketAnalysis-Intermarket Analysis
- MurphyExplainsMarketAnalysis-Visual Analysis
- StockCharts.com
- Technical Analysis of the Financial Markets
- The Visual Investor
- VectorVest, Inc.
- Executive Premier Workshop
- One-Day Options Course
- OptionsPro
- Retirement Income Workshop
- Sure-Fire Trading Systems (VectorVest, Inc.)
- Trading as a Business Workshop
- VectorVest 7 EOD
- VectorVest 7 RealTime/IntraDay
- VectorVest AutoTester
- VectorVest Educational Services
- VectorVest OnLine
- VectorVest Options Analyzer
- VectorVest ProGraphics v6.0
- VectorVest ProTrader 7
- VectorVest RealTime Derby Tool
- VectorVest Simulator
- VectorVest Variator
- VectorVest Watchdog
