HOT TOPICS LIST
- MACD
- Fibonacci
- RSI
- Gann
- ADXR
- Stochastics
- Volume
- Triangles
- Futures
- Cycles
- Volatility
- ZIGZAG
- MESA
- Retracement
- Aroon
INDICATORS LIST
LIST OF TOPICS
PRINT THIS ARTICLE
by Mike Carr, CMT
Martin Zweig wrote about the importance of the Value Line Index in the 1980s. It remains a useful indicator.
Position: Buy
Mike Carr, CMT
Mike Carr, CMT, is a member of the Market Technicians Association, and editor of the MTA's newsletter, Technically Speaking. He is also the author of "Smarter Investing in Any Economy: The Definitive Guide to Relative Strength Investing," and "Conquering the Divide: How to Use Economic Indicators to Catch Stock Market Trends."
PRINT THIS ARTICLE
ZIGZAG
Value Line Index Bullish
10/11/11 08:46:29 AMby Mike Carr, CMT
Martin Zweig wrote about the importance of the Value Line Index in the 1980s. It remains a useful indicator.
Position: Buy
| Analyst Martin Zweig's 1986 book, "Winning On Wall Street," detailed the 4% trading system. The rules were simply to buy when the Value Line Index is 4% above a low and sell when it declines 4% from a high. This was most likely adapted from the filtered waves that technician Arthur Merrill described about 10 years earlier in "Filtered Waves, Basic Theory: A Tool For Stock Market Analysis." |
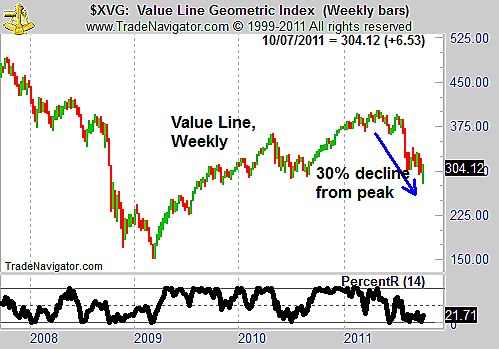
| In an update to his book, Zweig showed that from 1966 through 1993, the 4% long/short strategy delivered a 12.6% annualized gain, compared to a 2.7% gain for the index. After the reversal of the past week, the Value Line Index is on a buy signal (Figure 1). |

|
| FIGURE 1: THE VALUE LINE, WEEKLY. The Value Line Index offers reliable stock market signals. |
| Graphic provided by: Trade Navigator. |
| |
| This index measures the average daily changes in the stocks included in the Value Line investment universe. It is a geometric mean of the price activity, which has the advantage of eliminating many factors like market cap that are usually driving index changes in part. |
| According to the Value Line Index, there is no doubt that stocks suffered a bear market, falling 30% from their peaks earlier this year. Figure 1 also shows Williams' PercentR, a useful overbought/oversold tool. It just crossed above 20 after reaching oversold levels, signaling a buy. |
| Value Line is one of the broadest measures of the stock market. It is now on a buy, at a seasonally favorable time of year. |
Mike Carr, CMT, is a member of the Market Technicians Association, and editor of the MTA's newsletter, Technically Speaking. He is also the author of "Smarter Investing in Any Economy: The Definitive Guide to Relative Strength Investing," and "Conquering the Divide: How to Use Economic Indicators to Catch Stock Market Trends."
| Website: | www.moneynews.com/blogs/MichaelCarr/id-73 |
| E-mail address: | marketstrategist@gmail.com |
Click here for more information about our publications!
Comments

Request Information From Our Sponsors
- StockCharts.com, Inc.
- Candle Patterns
- Candlestick Charting Explained
- Intermarket Technical Analysis
- John Murphy on Chart Analysis
- John Murphy's Chart Pattern Recognition
- John Murphy's Market Message
- MurphyExplainsMarketAnalysis-Intermarket Analysis
- MurphyExplainsMarketAnalysis-Visual Analysis
- StockCharts.com
- Technical Analysis of the Financial Markets
- The Visual Investor
- VectorVest, Inc.
- Executive Premier Workshop
- One-Day Options Course
- OptionsPro
- Retirement Income Workshop
- Sure-Fire Trading Systems (VectorVest, Inc.)
- Trading as a Business Workshop
- VectorVest 7 EOD
- VectorVest 7 RealTime/IntraDay
- VectorVest AutoTester
- VectorVest Educational Services
- VectorVest OnLine
- VectorVest Options Analyzer
- VectorVest ProGraphics v6.0
- VectorVest ProTrader 7
- VectorVest RealTime Derby Tool
- VectorVest Simulator
- VectorVest Variator
- VectorVest Watchdog
