HOT TOPICS LIST
- MACD
- Fibonacci
- RSI
- Gann
- ADXR
- Stochastics
- Volume
- Triangles
- Futures
- Cycles
- Volatility
- ZIGZAG
- MESA
- Retracement
- Aroon
INDICATORS LIST
LIST OF TOPICS
PRINT THIS ARTICLE
by Matt Blackman
This market has been a little tougher than usual to trade. Bulls are claiming the bottom has been put in, while bears say there is worse to come. Based on these next indicators, the bears have probability on their side.
Position: N/A
Matt Blackman
Matt Blackman is a full-time technical and financial writer and trader. He produces corporate and financial newsletters, and assists clients in getting published in the mainstream media. He is the host of TradeSystemGuru.com. Matt has earned the Chartered Market Technician (CMT) designation. Find out what stocks and futures Matt is watching on Twitter at www.twitter.com/RatioTrade
PRINT THIS ARTICLE
DIVERGENCE INDEX
Are Market Challenges Rising?
10/11/11 08:40:18 AMby Matt Blackman
This market has been a little tougher than usual to trade. Bulls are claiming the bottom has been put in, while bears say there is worse to come. Based on these next indicators, the bears have probability on their side.
Position: N/A
| In my last Traders.com Advantage article, "Is This What A Capitulation Bottom Feels Like?" we looked at a pattern that looked like a promising sign that the bottom may be at hand. But since then, there have been some growing headwinds. |

|
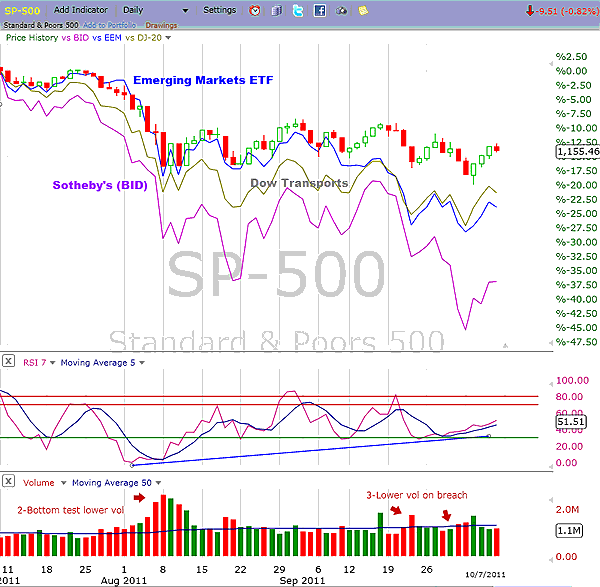
| FIGURE 1: S&P 500 VS. BID VS. EEM. Since early July, the S&P 500 has been the strongest of any of the other proxies -- the iShares Emerging Market ETF (EEM), the Dow Jones Transports Index (DJ-20), and Sotheby’s Auction House (BID). |
| Graphic provided by: FreeStockCharts.com. |
| |
| The Standard & Poor's 500 has pretty much held its own since the early August low and the bulls are saying that the big drop on October 3 was a fake down. But the same cannot be said about emerging markets, transports, and another good market proxy, Sotheby's (BID), which have continued to put in lower lows. See Figure 1. |
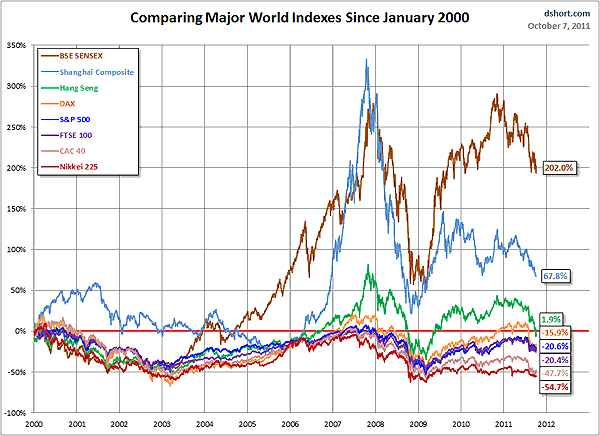
| Since January 2000, the major indexes of industrialized nations around the world have performed abysmally. The DAX is off 16%, the FTSE and S&P 500 100 are down 20% and 21%, respectively, the CAC 40 has lost 48%, and the Nikkei 225 is off 55%, according to Figure 2. But the same can't be said about the two indexes -- the Shanghai Composite and the BSE Index -- which have been the only real performers, and in the process have helped prevent developed economies and markets from falling further. |
| But this updraft looks to have come to an end if the iShares Emerging Markets Exchange Traded Fund EEM is any indication. Ditto for transports, which usually lead in a recovery. Sotheby's (BID), which has been an accurate bubble proxy, also continues to head lower, which is also bearish. |

|
| FIGURE 2: COMPARISON OF MAJOR WORLD INDEXES SINCE JANUARY 2000 |
| Graphic provided by: http://advisorperspectives.com/. |
| |
| If US markets are to enjoy any sort of sustainable recovery, they will continue to need help from emerging countries. Transports will give us an early heads-up that this trend has begun. However, current weakness in these leading indicators spells more trouble ahead. |
Matt Blackman is a full-time technical and financial writer and trader. He produces corporate and financial newsletters, and assists clients in getting published in the mainstream media. He is the host of TradeSystemGuru.com. Matt has earned the Chartered Market Technician (CMT) designation. Find out what stocks and futures Matt is watching on Twitter at www.twitter.com/RatioTrade
| Company: | TradeSystemGuru.com |
| Address: | Box 2589 |
| Garibaldi Highlands, BC Canada | |
| Phone # for sales: | 604-898-9069 |
| Fax: | 604-898-9069 |
| Website: | www.tradesystemguru.com |
| E-mail address: | indextradermb@gmail.com |
Traders' Resource Links | |
| TradeSystemGuru.com has not added any product or service information to TRADERS' RESOURCE. | |
Click here for more information about our publications!
PRINT THIS ARTICLE

|

Request Information From Our Sponsors
- StockCharts.com, Inc.
- Candle Patterns
- Candlestick Charting Explained
- Intermarket Technical Analysis
- John Murphy on Chart Analysis
- John Murphy's Chart Pattern Recognition
- John Murphy's Market Message
- MurphyExplainsMarketAnalysis-Intermarket Analysis
- MurphyExplainsMarketAnalysis-Visual Analysis
- StockCharts.com
- Technical Analysis of the Financial Markets
- The Visual Investor
- VectorVest, Inc.
- Executive Premier Workshop
- One-Day Options Course
- OptionsPro
- Retirement Income Workshop
- Sure-Fire Trading Systems (VectorVest, Inc.)
- Trading as a Business Workshop
- VectorVest 7 EOD
- VectorVest 7 RealTime/IntraDay
- VectorVest AutoTester
- VectorVest Educational Services
- VectorVest OnLine
- VectorVest Options Analyzer
- VectorVest ProGraphics v6.0
- VectorVest ProTrader 7
- VectorVest RealTime Derby Tool
- VectorVest Simulator
- VectorVest Variator
- VectorVest Watchdog
