HOT TOPICS LIST
- MACD
- Fibonacci
- RSI
- Gann
- ADXR
- Stochastics
- Volume
- Triangles
- Futures
- Cycles
- Volatility
- ZIGZAG
- MESA
- Retracement
- Aroon
INDICATORS LIST
LIST OF TOPICS
PRINT THIS ARTICLE
by Donald W. Pendergast, Jr.
Murphy Oil is showing that a powerful bullish reversal is under way after having put in a major divergence pattern. Will this market-wide rally last?
Position: N/A
Donald W. Pendergast, Jr.
Donald W. Pendergast is a financial markets consultant who offers specialized services to stock brokers and high net worth individuals who seek a better bottom line for their portfolios.
PRINT THIS ARTICLE
CHART ANALYSIS
Murphy Oil Gushing Higher
10/07/11 09:04:48 AMby Donald W. Pendergast, Jr.
Murphy Oil is showing that a powerful bullish reversal is under way after having put in a major divergence pattern. Will this market-wide rally last?
Position: N/A
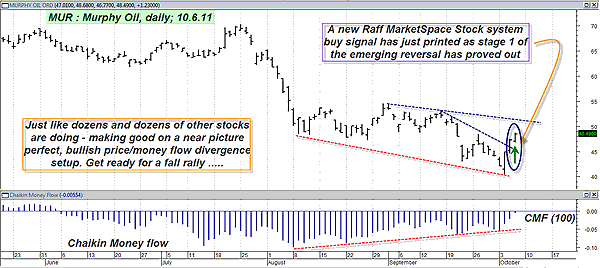
| With tons and tons of stocks putting in major reversals over the past week, it seems too easy to just pick out a chart and find that its pattern is almost a carbon copy of the rest. Perhaps that is because it takes major reversals by many stocks from a variety of industry groups for the charts of the major indexes to print bullish divergences as well. Here is a look at one of the better-defined reversal setups, this time in shares of Murphy Oil (MUR). See Figure 1. |

|
| FIGURE 1: MUR, DAILY. With a new Raff buy signal leading the charge higher, the positive technicals on this chart clearly support the notion of even higher prices ahead as this bullish reversal plays out. |
| Graphic provided by: MetaStock. |
| Graphic provided by: Raff MarketSpace Stock system from MetaStock 11. |
| |
| No super-technical revelations or neural networks here at all, just a time-tested chart pattern that tends to prove out over and over again, across time frames and markets. We see a declining price trend, one lasting for about 10 weeks, and at the very same time we also see that the valleys on the Chaikin money flow histogram (CMF) (100) kept getting higher (even though they were still below their zero line). Technically, this indicates accumulation; the smart money is buying into the decline, gradually establishing a position over time (typical of mutual funds) in anticipation of a sizable reversal back to the upside. If this is indeed what was going on, then those taking the calculated risk of doing so are now being rewarded with at least the satisfaction of having some open position profits on their books. Murphy has already cleared its prior swing high as well as a minor trendline and now appears well positioned to make an assault on the next downtrend channel line near the $51 area. Nothing attracts more bulls than an obviously strong bullish reversal, so look for the test of $51 to come sooner rather than later. Even better, with all of these reversal patterns happening all over the market, the odds of a sustainable fall rally grow stronger with each passing day. Stay tuned for more details. |
Donald W. Pendergast is a financial markets consultant who offers specialized services to stock brokers and high net worth individuals who seek a better bottom line for their portfolios.
| Title: | Writer, market consultant |
| Company: | Linear Trading Systems LLC |
| Jacksonville, FL 32217 | |
| Phone # for sales: | 904-239-9564 |
| E-mail address: | lineartradingsys@gmail.com |
Traders' Resource Links | |
| Linear Trading Systems LLC has not added any product or service information to TRADERS' RESOURCE. | |
Click here for more information about our publications!
PRINT THIS ARTICLE

Request Information From Our Sponsors
- StockCharts.com, Inc.
- Candle Patterns
- Candlestick Charting Explained
- Intermarket Technical Analysis
- John Murphy on Chart Analysis
- John Murphy's Chart Pattern Recognition
- John Murphy's Market Message
- MurphyExplainsMarketAnalysis-Intermarket Analysis
- MurphyExplainsMarketAnalysis-Visual Analysis
- StockCharts.com
- Technical Analysis of the Financial Markets
- The Visual Investor
- VectorVest, Inc.
- Executive Premier Workshop
- One-Day Options Course
- OptionsPro
- Retirement Income Workshop
- Sure-Fire Trading Systems (VectorVest, Inc.)
- Trading as a Business Workshop
- VectorVest 7 EOD
- VectorVest 7 RealTime/IntraDay
- VectorVest AutoTester
- VectorVest Educational Services
- VectorVest OnLine
- VectorVest Options Analyzer
- VectorVest ProGraphics v6.0
- VectorVest ProTrader 7
- VectorVest RealTime Derby Tool
- VectorVest Simulator
- VectorVest Variator
- VectorVest Watchdog
