HOT TOPICS LIST
- MACD
- Fibonacci
- RSI
- Gann
- ADXR
- Stochastics
- Volume
- Triangles
- Futures
- Cycles
- Volatility
- ZIGZAG
- MESA
- Retracement
- Aroon
INDICATORS LIST
LIST OF TOPICS
PRINT THIS ARTICLE
by Koos van der Merwe
Is Bristol-Myers Squibb a buy candidate? Let's see.
Position: Sell
Koos van der Merwe
Has been a technical analyst since 1969, and has worked as a futures and options trader with First Financial Futures in Johannesburg, South Africa.
PRINT THIS ARTICLE
MA ENVELOPES
Taking A Look At Bristol-Myers Squibb
10/07/11 08:56:13 AMby Koos van der Merwe
Is Bristol-Myers Squibb a buy candidate? Let's see.
Position: Sell
| Pharmaceutical companies have to continually reinvent themselves. When they develop a drug, after years of research, that drug has a limited patent lifespan before a generic company can manufacture and market the drug under a generic name and sell it at a fraction of the original price. The pharmaceutical company must price the drug so they can recover the cost of their research plus allow for sufficient profits to satisfy investors. And so the price of a pharmaceutical company will move depending on when a patent expires, or whenever a new highly effective drug is developed. |

|
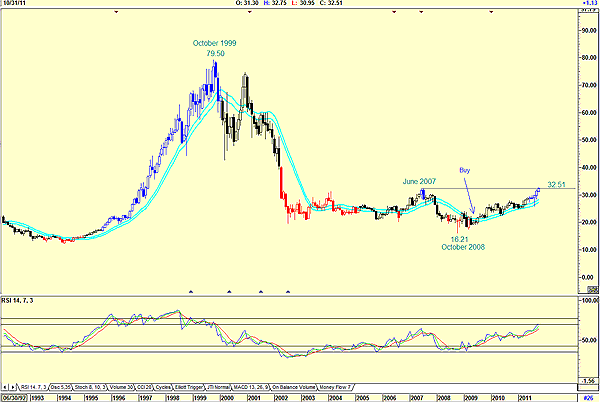
| FIGURE 1: BRISTOL-MYERS, MONTHLY |
| Graphic provided by: AdvancedGET. |
| |
| Figure 1 is a monthly chart of Bristol-Myers Squibb. The chart shows how the price fell from a high of $79.50 in October 1999 to a low of $16.21 by October 2008. With a buy signal given by the JM internal band (a 15-period simple moving average offset 2% positive and 2% negative), the price has risen steadily and is currently testing the resistance of $32.51, the pivot point of June 2007. |

|
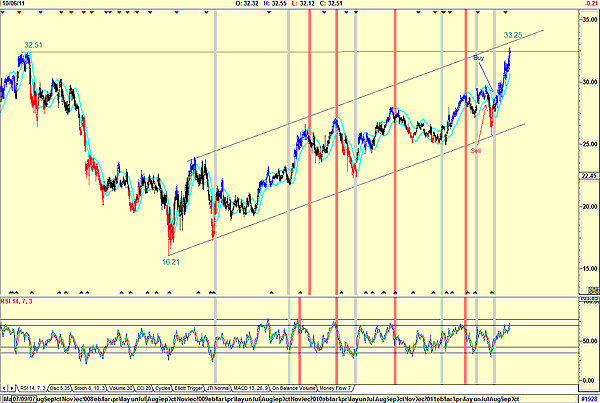
| FIGURE 2: BRISTOL-MYERS, DAILY |
| Graphic provided by: AdvancedGET. |
| |
| Figure 2 shows a daily chart indicating that the present price has penetrated the $32.51 resistance level. The target is $33.25, the upper trendline. With the relative strength index (RSI) at overbought levels but not yet giving a sell signal, this is very possible. Looking back through the chart, note how the JM indicator gave effective buy/sell signals almost along with the RSI signal. I would not be a buyer of this share at the moment. I would prefer waiting until the RSI fell to below the 32 level and the JM indicator gave a new buy signal before buying. |
Has been a technical analyst since 1969, and has worked as a futures and options trader with First Financial Futures in Johannesburg, South Africa.
| Address: | 3256 West 24th Ave |
| Vancouver, BC | |
| Phone # for sales: | 6042634214 |
| E-mail address: | petroosp@gmail.com |
Click here for more information about our publications!
PRINT THIS ARTICLE

Request Information From Our Sponsors
- VectorVest, Inc.
- Executive Premier Workshop
- One-Day Options Course
- OptionsPro
- Retirement Income Workshop
- Sure-Fire Trading Systems (VectorVest, Inc.)
- Trading as a Business Workshop
- VectorVest 7 EOD
- VectorVest 7 RealTime/IntraDay
- VectorVest AutoTester
- VectorVest Educational Services
- VectorVest OnLine
- VectorVest Options Analyzer
- VectorVest ProGraphics v6.0
- VectorVest ProTrader 7
- VectorVest RealTime Derby Tool
- VectorVest Simulator
- VectorVest Variator
- VectorVest Watchdog
- StockCharts.com, Inc.
- Candle Patterns
- Candlestick Charting Explained
- Intermarket Technical Analysis
- John Murphy on Chart Analysis
- John Murphy's Chart Pattern Recognition
- John Murphy's Market Message
- MurphyExplainsMarketAnalysis-Intermarket Analysis
- MurphyExplainsMarketAnalysis-Visual Analysis
- StockCharts.com
- Technical Analysis of the Financial Markets
- The Visual Investor
