

HOT TOPICS LIST
- MACD
- Fibonacci
- RSI
- Gann
- ADXR
- Stochastics
- Volume
- Triangles
- Futures
- Cycles
- Volatility
- ZIGZAG
- MESA
- Retracement
- Aroon
INDICATORS LIST
LIST OF TOPICS
PRINT THIS ARTICLE
by Billy Williams
The SPX touched on support on October 4 and then rallied. Now, the question is: Will it hold?
Position: Hold
Billy Williams
Billy Williams has been trading the markets for 27 years, specializing in momentum trading with stocks and options.
PRINT THIS ARTICLE
SUPPORT & RESISTANCE
Can Support Hold In The SPX?
10/06/11 11:40:09 AMby Billy Williams
The SPX touched on support on October 4 and then rallied. Now, the question is: Will it hold?
Position: Hold
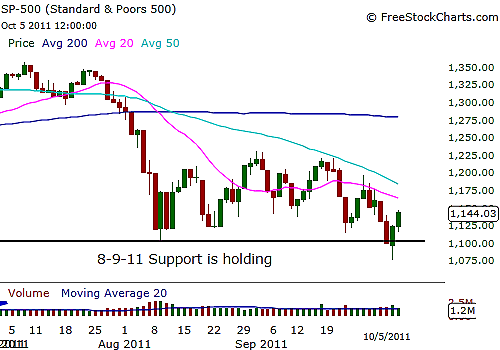
| Right now, you can see that a reaction took place in the Standard & Poor's 500 as yesterday's price action traded down to the previous price lows established on August 9, 2011, almost two months ago. Price traded down hard in the first half hour of trading on October 4 but then rebounded and steadily climbed for the rest of the day, trading up more than 1% from the open on higher volume. This makes October 4 the first day in William O'Neil's "follow through day" (FTD) method that identifies a price bottom being made in the general market with high success. Be mindful for the next few days, because for this method to work you'll need to watch for another price rally of 1% or greater on higher than the previous day's trading volume between trading days 4 and 7 for the price bottom to be confirmed, which will give you the go-ahead to begin looking to trade to the upside again. Since stocks move as much as 70% to 80% in tandem with the overall market, this gives you the green light to begin trading on the long side. You want to watch the next few days for a rally that will confirm the bottom is in place and then select the stocks that have a combination of compelling fundamental factors as well as technical factors. See Figure 1. |
|
| FIGURE 1: SPX. Technical confluence occurred as the SPX both touched an area of price support and rallied more than 1% on greater volume. Now, will a bottom form and a rally occur? |
| Graphic provided by: www.freestockcharts.com. |
| |
| Now, what you need to watch for is making sure that price does not trade below the October 4th price low. Otherwise, the FTD count is scratched and you have to watch for another price bar at or near the price low that rallies greater than 1% on higher than the previous day's trading volume. Some of the fundamental factors to consider are stocks that have a number of outstanding shares -- 200 million or less (the lower the better); stock float -- 175 million or less (the lower the better); growth rate (annual compound) 25% or higher; consecutive yearly earnings increase (minimum two years); strong earnings estimate (next two years) 20% or higher if earnings estimate only available for one year (or increase consecutive yearly earnings increase to minimum three years); earnings increase last two quarters 25% or higher; last four quarterly sales increase 20% or more; no debt or very low debt (less than 30%), and funds and banks own total of 5% or more as some of the key criteria when selecting strong stock candidates for long trades. On the technical side, you want to look for stocks that have been trading in a tight range near their 52-week price high or, better yet, their all-time high. Stocks trading at their all-time high have been statistically proven to make greater overall returns based on that factor alone when compared to other high-performing stocks and also because there is less overhead resistance. Overhead resistance is where there were previous price highs and lows reached as a stock trades up to those levels again and experiences a flurry of selling, which may cause a reaction in price. This happens because there are pockets of investors who bought at those levels and have refused to sell to prevent taking a loss, and most are thrilled to sell when price returns to their buy point so that they can get out and break even. |
|
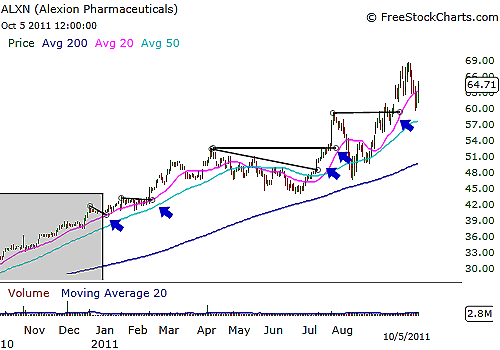
| FIGURE 2: ALXN. ALXN is a high-performing stock with a number of compelling fundamental and technical factors that make it stand out as a viable candidate for a runaway move if a bottom in the general market forms. |
| Graphic provided by: www.freestockcharts.com. |
| |
| This creates resistance for the stock's price action, and price needs to readjust. So if you decide to trade a stock that is not at their all-time high, just be aware of this phenomenon so you can adjust your strategy for it. Alexion Pharmaceuticals is one of those companies that possesses a number of attractive qualities for a trader to consider and has been holding up incredibly well in a tsunami of weakness and selling in the current market. Though it is slightly off its price high, its trend is still in place, and if the market turns around, this stock may have a lot of upside potential. See Figure 2. |
| Finally, though the market is incredibly weak and the global macro-economic outlook is poor with much being written about the poor future prospects for equities, as a trader, you must consider what price is telling you now, not trying to predict the future of the stock market. For a trader and technician, you have to look at the facts as they are presented, and the market is at a support level that could be ground zero for a new bull run if the FTD is confirmed. In order for you to profit, you have to be prepared to act with cold precision. Watch the market closely over the next few days and have your stock candidates picked and be ready to act if a rally appears. |
Billy Williams has been trading the markets for 27 years, specializing in momentum trading with stocks and options.
| Company: | StockOptionSystem.com |
| E-mail address: | stockoptionsystem.com@gmail.com |
Traders' Resource Links | |
| StockOptionSystem.com has not added any product or service information to TRADERS' RESOURCE. | |
Click here for more information about our publications!
PRINT THIS ARTICLE

Request Information From Our Sponsors
- StockCharts.com, Inc.
- Candle Patterns
- Candlestick Charting Explained
- Intermarket Technical Analysis
- John Murphy on Chart Analysis
- John Murphy's Chart Pattern Recognition
- John Murphy's Market Message
- MurphyExplainsMarketAnalysis-Intermarket Analysis
- MurphyExplainsMarketAnalysis-Visual Analysis
- StockCharts.com
- Technical Analysis of the Financial Markets
- The Visual Investor
- VectorVest, Inc.
- Executive Premier Workshop
- One-Day Options Course
- OptionsPro
- Retirement Income Workshop
- Sure-Fire Trading Systems (VectorVest, Inc.)
- Trading as a Business Workshop
- VectorVest 7 EOD
- VectorVest 7 RealTime/IntraDay
- VectorVest AutoTester
- VectorVest Educational Services
- VectorVest OnLine
- VectorVest Options Analyzer
- VectorVest ProGraphics v6.0
- VectorVest ProTrader 7
- VectorVest RealTime Derby Tool
- VectorVest Simulator
- VectorVest Variator
- VectorVest Watchdog