HOT TOPICS LIST
- MACD
- Fibonacci
- RSI
- Gann
- ADXR
- Stochastics
- Volume
- Triangles
- Futures
- Cycles
- Volatility
- ZIGZAG
- MESA
- Retracement
- Aroon
INDICATORS LIST
LIST OF TOPICS
PRINT THIS ARTICLE
by Mike Carr, CMT
The stock plummeted after the company changed its business model, but technicians could have avoided the worst of the decline.
Position: Buy
Mike Carr, CMT
Mike Carr, CMT, is a member of the Market Technicians Association, and editor of the MTA's newsletter, Technically Speaking. He is also the author of "Smarter Investing in Any Economy: The Definitive Guide to Relative Strength Investing," and "Conquering the Divide: How to Use Economic Indicators to Catch Stock Market Trends."
PRINT THIS ARTICLE
CHART ANALYSIS
Netflix Demonstrates Value Of Technical Analysis
10/06/11 08:58:34 AMby Mike Carr, CMT
The stock plummeted after the company changed its business model, but technicians could have avoided the worst of the decline.
Position: Buy
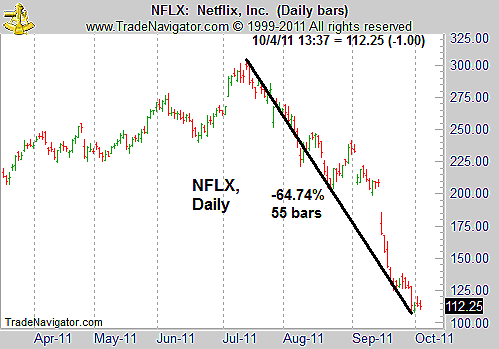
| Both sides in the argument over market efficiency have some support in the recent price action of Netflix (NFLX) (Figure 1). The stock fell more than 60% in less than three months as the company made significant changes to its subscriptions plans. Those who argue that markets are efficient, meaning that a stock's price adjusts rapidly to news after it's released, can say that NFLX moved lower as investors realized the company would lose subscribers. On the other side of the argument is the fact that this decline unfolded over months rather than days and the company hasn't really lost any subscribers yet (it seems to be gaining new subscribers at a slower pace). Given that the new business model should increase profits per subscriber, NFLX may be even more profitable in the future. |

|
| FIGURE 1: NFLX, DAILY. NFLX fell as the company announced changes to its popular DVD rental services. |
| Graphic provided by: Trade Navigator. |
| |
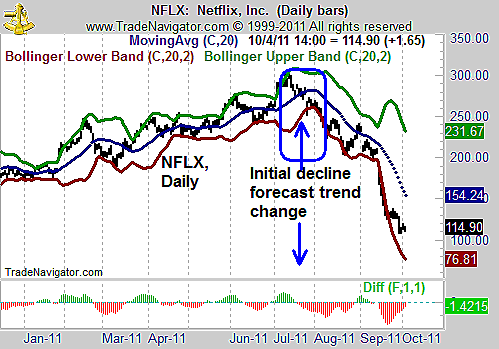
| Figure 2 shows that NFLX was a sell based on the technicals when the price was within about 10% of its highs. Here's momentum, shown as the moving average convergence/divergence (MACD) turned negative and price broke below the lower Bollinger Band. |

|
| FIGURE 2: NFLX, DAILY. The daily chart offered sell signals in NFLX before the decline. |
| Graphic provided by: Trade Navigator. |
| |
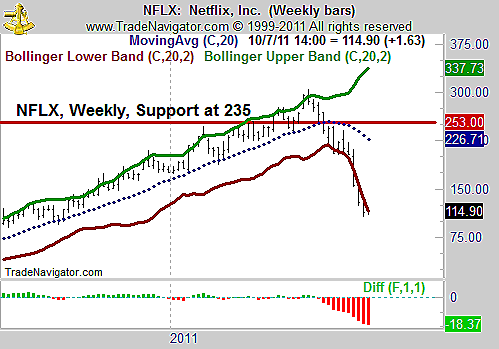
| Figure 3 shows the same bearish picture in the weekly time frame. |

|
| FIGURE 3: NFLX, WEEKLY. Technical analysis would have helped investors avoid most of the losses in NFLX. |
| Graphic provided by: Trade Navigator. |
| |
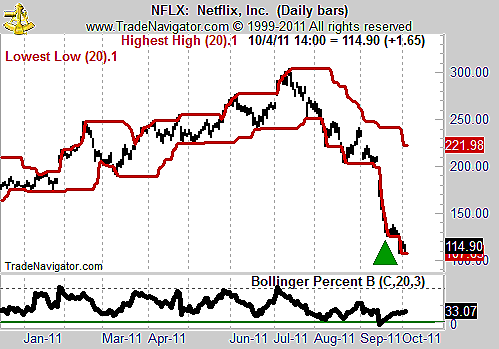
| Technical analysis also shows NFLX can be bought as a low-risk trade now (Figure 4). The chart shows Bollinger PercentB to highlight the extreme nature of the price move as the price fell through the lower Bollinger Band with the bands set to three standard deviations. This will spot only extremely rare moves; less than 0.5% of market action falls outside this lower band in theory. The break back above the lower band is the buy signal. |

|
| FIGURE 4: NFLX, DAILY. The buy signal was early, but it may still deliver a profit as the stock market recovers. |
| Graphic provided by: Trade Navigator. |
| |
| Donchian bands are used to define a price target, and in this case, it is 50% above the current level. NFLX looks like a low-risk, high-potential reward trade. |
Mike Carr, CMT, is a member of the Market Technicians Association, and editor of the MTA's newsletter, Technically Speaking. He is also the author of "Smarter Investing in Any Economy: The Definitive Guide to Relative Strength Investing," and "Conquering the Divide: How to Use Economic Indicators to Catch Stock Market Trends."
| Website: | www.moneynews.com/blogs/MichaelCarr/id-73 |
| E-mail address: | marketstrategist@gmail.com |
Click here for more information about our publications!
Comments

Request Information From Our Sponsors
- StockCharts.com, Inc.
- Candle Patterns
- Candlestick Charting Explained
- Intermarket Technical Analysis
- John Murphy on Chart Analysis
- John Murphy's Chart Pattern Recognition
- John Murphy's Market Message
- MurphyExplainsMarketAnalysis-Intermarket Analysis
- MurphyExplainsMarketAnalysis-Visual Analysis
- StockCharts.com
- Technical Analysis of the Financial Markets
- The Visual Investor
- VectorVest, Inc.
- Executive Premier Workshop
- One-Day Options Course
- OptionsPro
- Retirement Income Workshop
- Sure-Fire Trading Systems (VectorVest, Inc.)
- Trading as a Business Workshop
- VectorVest 7 EOD
- VectorVest 7 RealTime/IntraDay
- VectorVest AutoTester
- VectorVest Educational Services
- VectorVest OnLine
- VectorVest Options Analyzer
- VectorVest ProGraphics v6.0
- VectorVest ProTrader 7
- VectorVest RealTime Derby Tool
- VectorVest Simulator
- VectorVest Variator
- VectorVest Watchdog
