HOT TOPICS LIST
- MACD
- Fibonacci
- RSI
- Gann
- ADXR
- Stochastics
- Volume
- Triangles
- Futures
- Cycles
- Volatility
- ZIGZAG
- MESA
- Retracement
- Aroon
INDICATORS LIST
LIST OF TOPICS
PRINT THIS ARTICLE
by Donald W. Pendergast, Jr.
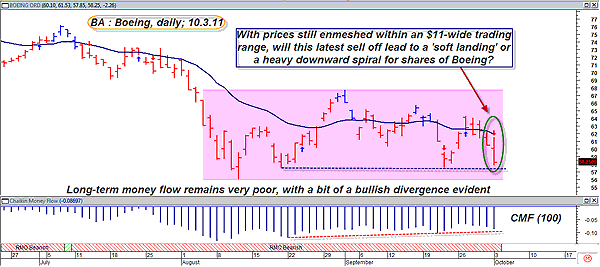
Boeing (BA) is one of the long-time components in the Dow Jones Industrial average (DJIA) and in the Standard & Poor's 100 (OEX) and S&P 500 (SPX). Truly an industrial stock, one based on heavy equipment manufacturing, BA is as good a proxy as any when it comes to discerning the general health of the US's economy and also the condition of the airline industry group. Let's take a look at the overall technical setup on BA's daily chart and the new Rahul Mohindar oscillator (RMO) swing sell signal that just fired on Monday, October 3. See Figure 1.
Position: N/A
Donald W. Pendergast, Jr.
Donald W. Pendergast is a financial markets consultant who offers specialized services to stock brokers and high net worth individuals who seek a better bottom line for their portfolios.
PRINT THIS ARTICLE
TRADING SYSTEMS
Boeing Flying South Again?
10/05/11 09:30:41 AMby Donald W. Pendergast, Jr.
Boeing (BA) is one of the long-time components in the Dow Jones Industrial average (DJIA) and in the Standard & Poor's 100 (OEX) and S&P 500 (SPX). Truly an industrial stock, one based on heavy equipment manufacturing, BA is as good a proxy as any when it comes to discerning the general health of the US's economy and also the condition of the airline industry group. Let's take a look at the overall technical setup on BA's daily chart and the new Rahul Mohindar oscillator (RMO) swing sell signal that just fired on Monday, October 3. See Figure 1.
Position: N/A
| As bad as the recent price action in the Russell 2000 index has been, by comparison, this little slide in BA looks relatively benign, appearing more like the tail end of an eight-week long price consolidation. There is the new RMO swing sell signal, but just as in the case of Goldman Sachs (see my previous Traders.com Advantage article, "In Goldman Sachs, A Bullish Money Flow Divergence Beckons"), a slightly bullish price/money flow divergence exists (based on the 100-day Chaikin money flow histogram at the bottom of the chart [CMF][100]), which suggests that institutions are turning a bit more positive on shares of BA. In addition, note the $11-wide trading range (pink shaded area) that has printed during the last two months; the stock has to break down through two separate support levels -- one near $57.50 and the other at $56.01 -- before a full-scale avalanche of new selling pressure is likely seen. Be wary going short right now in BA, as the broad market is vulnerable to a short-covering squeeze, and as such, selling BA short while it's still in a very well-protected trading range could prove to be a very costly and unnecessary trading mistake. I believe in the power of intelligent trading systems, but I also have seen plenty of broad market/individual stock scenarios like this, and usually it's a wise move to pass on such a short setup until the market situation becomes less confusing and cluttered. A word to the wise should be sufficient. |

|
| FIGURE 1: BA, DAILY. Unless you're a totally committed system trader, it might pay to be a little wary of short sell signals occurring just above a pair of strong support levels, especially if the broad markets are getting a bit ahead of themselves on the downside. |
| Graphic provided by: MetaStock. |
| |
| Seasonality charts still support the notion of a modestly strong yearend rally in the broad market indexes, but don't rely too heavily on seasonals unless the rest of your technical and fundamental analysis also goes along with it. When all three factors are working together in harmony, your probabilities for success increase dramatically. |
Donald W. Pendergast is a financial markets consultant who offers specialized services to stock brokers and high net worth individuals who seek a better bottom line for their portfolios.
| Title: | Writer, market consultant |
| Company: | Linear Trading Systems LLC |
| Jacksonville, FL 32217 | |
| Phone # for sales: | 904-239-9564 |
| E-mail address: | lineartradingsys@gmail.com |
Traders' Resource Links | |
| Linear Trading Systems LLC has not added any product or service information to TRADERS' RESOURCE. | |
Click here for more information about our publications!
PRINT THIS ARTICLE

Request Information From Our Sponsors
- StockCharts.com, Inc.
- Candle Patterns
- Candlestick Charting Explained
- Intermarket Technical Analysis
- John Murphy on Chart Analysis
- John Murphy's Chart Pattern Recognition
- John Murphy's Market Message
- MurphyExplainsMarketAnalysis-Intermarket Analysis
- MurphyExplainsMarketAnalysis-Visual Analysis
- StockCharts.com
- Technical Analysis of the Financial Markets
- The Visual Investor
- VectorVest, Inc.
- Executive Premier Workshop
- One-Day Options Course
- OptionsPro
- Retirement Income Workshop
- Sure-Fire Trading Systems (VectorVest, Inc.)
- Trading as a Business Workshop
- VectorVest 7 EOD
- VectorVest 7 RealTime/IntraDay
- VectorVest AutoTester
- VectorVest Educational Services
- VectorVest OnLine
- VectorVest Options Analyzer
- VectorVest ProGraphics v6.0
- VectorVest ProTrader 7
- VectorVest RealTime Derby Tool
- VectorVest Simulator
- VectorVest Variator
- VectorVest Watchdog
