HOT TOPICS LIST
- MACD
- Fibonacci
- RSI
- Gann
- ADXR
- Stochastics
- Volume
- Triangles
- Futures
- Cycles
- Volatility
- ZIGZAG
- MESA
- Retracement
- Aroon
INDICATORS LIST
LIST OF TOPICS
PRINT THIS ARTICLE
by Matt Blackman
This has been a tough market no matter which way you slice it, with signals to confuse even the most stalwart traders. But here is one pattern that looks promising.
Position: N/A
Matt Blackman
Matt Blackman is a full-time technical and financial writer and trader. He produces corporate and financial newsletters, and assists clients in getting published in the mainstream media. He is the host of TradeSystemGuru.com. Matt has earned the Chartered Market Technician (CMT) designation. Find out what stocks and futures Matt is watching on Twitter at www.twitter.com/RatioTrade
PRINT THIS ARTICLE
VOL UP /DOWN DAY
Is This What A Capitulation Bottom Feels Like?
10/05/11 09:15:57 AMby Matt Blackman
This has been a tough market no matter which way you slice it, with signals to confuse even the most stalwart traders. But here is one pattern that looks promising.
Position: N/A
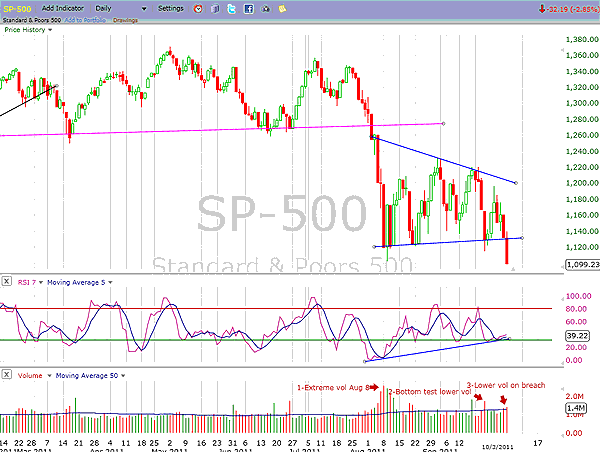
| Since the Standard & Poor's 500 put in the August 8th low, analysts of all persuasions have been making various pattern calls and suggested where the market is headed from here. This action has been anything but straightforward. First, the bulls got excited as the index looked to be putting in a bullish W-catapult pattern. But then this broke down into something more akin to a bear flag, which after four weeks morphed into something more like a rising wedge. But until October 3, the August low held firm. See Figure 1. |

|
| FIGURE 1: SPX, DAILY. Here's a chart showing a potential capitulation setup on the SPX. Note that volume peaks on the first low (August 8) is lower on the next test on September 22 and lower again on the trendline support breach on October 3. |
| Graphic provided by: FreeStockCharts.com. |
| |
| An interesting article entitled "S&P 500 Set To Rebound?" by Don and Jon Vialoux of EquityClock.com, which appeared in the Financial Post on September 30, described another possibility. As many know, September has a bad reputation for the market as months go, but a number of the most brutal drops have occurred in October. Octobers in 1929, 1987, and 2008 are perhaps most infamous. But October is also well known for putting in capitulation lows, which occurs when a low is put in on extremely high volume, tested on lower volume a few times, with the first low usually not being significantly breached. |
| According to the Vialouxes, since 1929 the SPX has completed 13 capitulation lows, and the pattern is confirmed by two indicators. First, the percent of SPX stocks trading above their 50-day moving average (MA) falls below 5%, and second, the percent of stocks trading above their 200-day MA drops below 14%. On August 8, there were 0.40% trading above their 50-day, and 8.6% trading above their 200-day. |
| After a capitulation low, the index gains sharply on falling volume during the three weeks after the low, successfully testing the low over the next three to four weeks, then experiences an upside breakout of its trading range. Since August 8, the SPX has rallied 11.7% on declining volume to put in a high of 1230.71. So if this is indeed a capitulation low, look for the index to break above this level later on in October or early November on rising volume. |
| One caveat, as the Vialouxes point out, is the fact that the low was broken (October 3), which is rare. However, they do concede that it occurred on much lower volume than prior support tests, which is bullish. Another is the fact that no one knows how much messier the European situation will get in the next few months, and that could substantially alter this bullish scenario. |
Matt Blackman is a full-time technical and financial writer and trader. He produces corporate and financial newsletters, and assists clients in getting published in the mainstream media. He is the host of TradeSystemGuru.com. Matt has earned the Chartered Market Technician (CMT) designation. Find out what stocks and futures Matt is watching on Twitter at www.twitter.com/RatioTrade
| Company: | TradeSystemGuru.com |
| Address: | Box 2589 |
| Garibaldi Highlands, BC Canada | |
| Phone # for sales: | 604-898-9069 |
| Fax: | 604-898-9069 |
| Website: | www.tradesystemguru.com |
| E-mail address: | indextradermb@gmail.com |
Traders' Resource Links | |
| TradeSystemGuru.com has not added any product or service information to TRADERS' RESOURCE. | |
Click here for more information about our publications!
Comments

|

Request Information From Our Sponsors
- VectorVest, Inc.
- Executive Premier Workshop
- One-Day Options Course
- OptionsPro
- Retirement Income Workshop
- Sure-Fire Trading Systems (VectorVest, Inc.)
- Trading as a Business Workshop
- VectorVest 7 EOD
- VectorVest 7 RealTime/IntraDay
- VectorVest AutoTester
- VectorVest Educational Services
- VectorVest OnLine
- VectorVest Options Analyzer
- VectorVest ProGraphics v6.0
- VectorVest ProTrader 7
- VectorVest RealTime Derby Tool
- VectorVest Simulator
- VectorVest Variator
- VectorVest Watchdog
- StockCharts.com, Inc.
- Candle Patterns
- Candlestick Charting Explained
- Intermarket Technical Analysis
- John Murphy on Chart Analysis
- John Murphy's Chart Pattern Recognition
- John Murphy's Market Message
- MurphyExplainsMarketAnalysis-Intermarket Analysis
- MurphyExplainsMarketAnalysis-Visual Analysis
- StockCharts.com
- Technical Analysis of the Financial Markets
- The Visual Investor
