HOT TOPICS LIST
- MACD
- Fibonacci
- RSI
- Gann
- ADXR
- Stochastics
- Volume
- Triangles
- Futures
- Cycles
- Volatility
- ZIGZAG
- MESA
- Retracement
- Aroon
INDICATORS LIST
LIST OF TOPICS
PRINT THIS ARTICLE
by Donald W. Pendergast, Jr.
With a very pronounced bullish money flow/price divergence in place, shares of Goldman Sachs might very well be on some smart shopper's accumulate list.
Position: N/A
Donald W. Pendergast, Jr.
Donald W. Pendergast is a financial markets consultant who offers specialized services to stock brokers and high net worth individuals who seek a better bottom line for their portfolios.
PRINT THIS ARTICLE
CHART ANALYSIS
In Goldman Sachs, Bullish Money Flow Divergence Beckons
10/03/11 11:22:33 AMby Donald W. Pendergast, Jr.
With a very pronounced bullish money flow/price divergence in place, shares of Goldman Sachs might very well be on some smart shopper's accumulate list.
Position: N/A
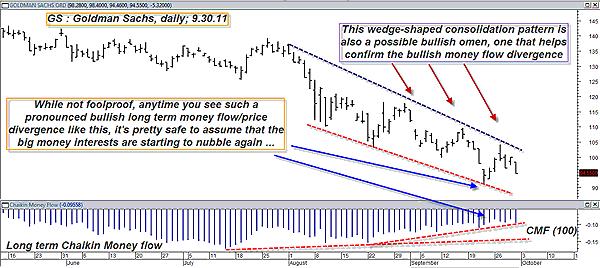
| While there is no shortage of Rahul Mohindar oscillator (RMO) swing sell signals in the .SPX (as of Friday, September 30, 2011, there were 55 RMO swing sell signals, nearly 12% of the index), I decided to dig a little and see how many of them were also manifesting signs of bullish long-term price/money flow divergence. While doing so, I was intrigued by the same bullish divergence pattern you see on the chart of Goldman Sachs (GS) here (Figure 1). Normally, short-term divergences are better suited for intraday or short-term swing traders, but the long-term bullish divergence you see here could be a real attraction for those traders/investors who like to build a substantial position in a stock over a period of weeks (or even months), using either a dollar cost averaging method or even a more sophisticated pyramiding method. For example, if you want to own a 100-share position in GS but are hesitant to go all in right now (smart thinking), why not use a pyramiding method like this: * Buy 10 shares at $95.00 limit * Buy 15 shares at $92.50 limit * Buy 20 shares at $90.00 limit * Buy 25 shares at $87.50 limit * Buy 30 shares at $85.00 limit Place a stop-loss on the entire position of 100 shares at $82.50, assuming it all gets filled, and your maximum loss on the entire position before slippage and commissions is about $626 (based on an average price of $88.76). If your conservative price target for the stock is $109.66 (the mid-September swing high), you end up with a very favorable risk/reward ratio of 3.34 to 1, assuming you've got the next series of moves in the stock accurately figured out (possible, but not likely). The pyramiding method has you putting on smaller positions at higher prices and larger positions at lower prices, and it can work very nicely if you can time a stock hitting a major swing low price zone within a specified time window with high reliability. If you can't do that very well, however, your safest way to play GS on the long side is to take the next RMO swing buy signal and then use a three-bar trailing stop of the daily lows as your trade management method of choice. You won't get in the stock at the lowest possible price, but you'll have a more objective and possibly stress-free way to play Goldman shares, should an autumn rally erupt soon. |

|
| FIGURE 1: GS, DAILY. The descending wedge pattern occurs at the same time that the long-term money flow trend is manifesting a noticeably bullish divergence with the price action on the chart, a likely confirmation of big money accumulation. |
| Graphic provided by: MetaStock. |
| |
| Take some time and work out various scale and pyramid trading methods in a spreadsheet and see if you can't begin to cook up a variety of new ways to (hopefully) extract trading profits from the stock market. |
Donald W. Pendergast is a financial markets consultant who offers specialized services to stock brokers and high net worth individuals who seek a better bottom line for their portfolios.
| Title: | Writer, market consultant |
| Company: | Linear Trading Systems LLC |
| Jacksonville, FL 32217 | |
| Phone # for sales: | 904-239-9564 |
| E-mail address: | lineartradingsys@gmail.com |
Traders' Resource Links | |
| Linear Trading Systems LLC has not added any product or service information to TRADERS' RESOURCE. | |
Click here for more information about our publications!
Comments

Request Information From Our Sponsors
- StockCharts.com, Inc.
- Candle Patterns
- Candlestick Charting Explained
- Intermarket Technical Analysis
- John Murphy on Chart Analysis
- John Murphy's Chart Pattern Recognition
- John Murphy's Market Message
- MurphyExplainsMarketAnalysis-Intermarket Analysis
- MurphyExplainsMarketAnalysis-Visual Analysis
- StockCharts.com
- Technical Analysis of the Financial Markets
- The Visual Investor
- VectorVest, Inc.
- Executive Premier Workshop
- One-Day Options Course
- OptionsPro
- Retirement Income Workshop
- Sure-Fire Trading Systems (VectorVest, Inc.)
- Trading as a Business Workshop
- VectorVest 7 EOD
- VectorVest 7 RealTime/IntraDay
- VectorVest AutoTester
- VectorVest Educational Services
- VectorVest OnLine
- VectorVest Options Analyzer
- VectorVest ProGraphics v6.0
- VectorVest ProTrader 7
- VectorVest RealTime Derby Tool
- VectorVest Simulator
- VectorVest Variator
- VectorVest Watchdog
