HOT TOPICS LIST
- MACD
- Fibonacci
- RSI
- Gann
- ADXR
- Stochastics
- Volume
- Triangles
- Futures
- Cycles
- Volatility
- ZIGZAG
- MESA
- Retracement
- Aroon
INDICATORS LIST
LIST OF TOPICS
PRINT THIS ARTICLE
by Austin Passamonte
Here's the midterm outlook for ZS soybean and ZC corn futures.
Position: N/A
Austin Passamonte
Austin is a private trader who trades emini stock index futures intraday. He currently trades various futures markets from home in addition to managing a trader's educational forum
PRINT THIS ARTICLE
TECHNICAL ANALYSIS
Crushed Soy
10/03/11 11:33:35 AMby Austin Passamonte
Here's the midterm outlook for ZS soybean and ZC corn futures.
Position: N/A
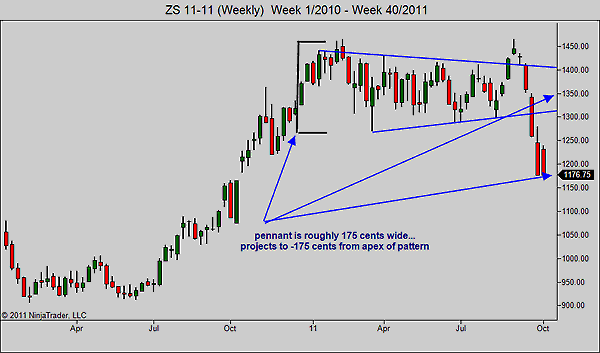
| The grain complex in commodity futures have enjoyed substantial price rallies in the past year or so. But sideways consolidation near peak highs through much of 2011 has set the stage for continued legs higher or pullbacks to test, back, and fill lower zones below. See Figure 1. |

|
| FIGURE 1: ZS, WEEKLY |
| Graphic provided by: NinjaTrader. |
| |
| Standard technical analysis measurement of weekly chart pennant formations projected price targets right where resting price is today from the recent break lower. That does not mean by any means that lower potential price movement cannot or will not happen -- just that price has reached a technical point of reactionary pause. See Figure 2. |

|
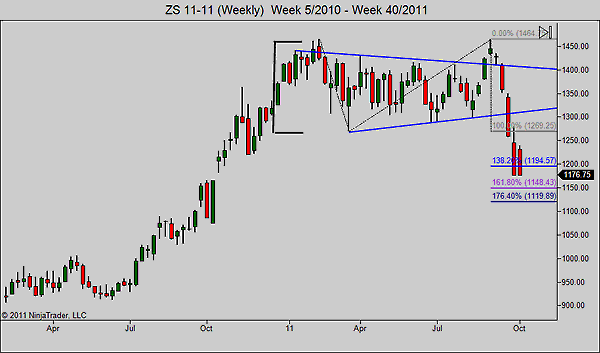
| FIGURE 2: ZS, WEEKLY |
| Graphic provided by: NinjaTrader. |
| |
| Applying a 1-2-3 Fibonacci retrace from double-top highs and swing low between projects into the lower 1100s where wide-range bars were formed back in October 2010. |

|
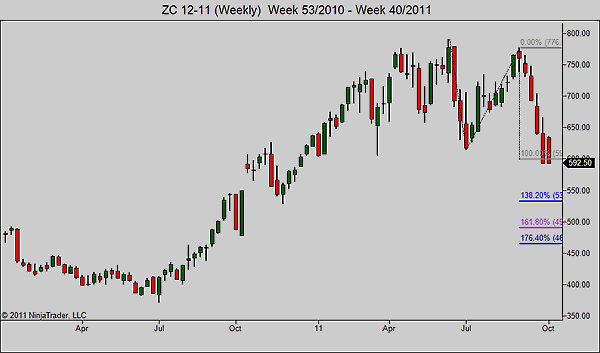
| FIGURE 3: ZC, WEEKLY |
| Graphic provided by: NinjaTrader. |
| |
| The same view of corn futures (ZC) shows pretty much a lock-step movement unfolding. Double-top high sells off hard, pauses at 100% projection, and looks toward the 450-500 zone where last October's volatility beckons a retest to confirm support. See Figure 3. |
| Grain futures are heavily buffeted at this time of the year by old-crop storage = new-crop harvest supplies in addition to US dollar valuations, which affect global demand and pressures on pricing. With widened daily limit moves and heightened global economic uncertainty, grain futures could easily see limit-down moves to lower zones of support without further warning. |
Austin is a private trader who trades emini stock index futures intraday. He currently trades various futures markets from home in addition to managing a trader's educational forum
| Title: | Individual Trader |
| Company: | CoiledMarkets.com |
| Address: | PO Box 633 |
| Naples, NY 14512 | |
| Website: | coiledmarkets.com/blog |
| E-mail address: | austinp44@yahoo.com |
Traders' Resource Links | |
| CoiledMarkets.com has not added any product or service information to TRADERS' RESOURCE. | |
Click here for more information about our publications!
Comments

Request Information From Our Sponsors
- StockCharts.com, Inc.
- Candle Patterns
- Candlestick Charting Explained
- Intermarket Technical Analysis
- John Murphy on Chart Analysis
- John Murphy's Chart Pattern Recognition
- John Murphy's Market Message
- MurphyExplainsMarketAnalysis-Intermarket Analysis
- MurphyExplainsMarketAnalysis-Visual Analysis
- StockCharts.com
- Technical Analysis of the Financial Markets
- The Visual Investor
- VectorVest, Inc.
- Executive Premier Workshop
- One-Day Options Course
- OptionsPro
- Retirement Income Workshop
- Sure-Fire Trading Systems (VectorVest, Inc.)
- Trading as a Business Workshop
- VectorVest 7 EOD
- VectorVest 7 RealTime/IntraDay
- VectorVest AutoTester
- VectorVest Educational Services
- VectorVest OnLine
- VectorVest Options Analyzer
- VectorVest ProGraphics v6.0
- VectorVest ProTrader 7
- VectorVest RealTime Derby Tool
- VectorVest Simulator
- VectorVest Variator
- VectorVest Watchdog
