HOT TOPICS LIST
- MACD
- Fibonacci
- RSI
- Gann
- ADXR
- Stochastics
- Volume
- Triangles
- Futures
- Cycles
- Volatility
- ZIGZAG
- MESA
- Retracement
- Aroon
INDICATORS LIST
LIST OF TOPICS
PRINT THIS ARTICLE
by Koos van der Merwe
In Elliott wave theory, a bear market is usually described as an A-B-C correction.
Position: Buy
Koos van der Merwe
Has been a technical analyst since 1969, and has worked as a futures and options trader with First Financial Futures in Johannesburg, South Africa.
PRINT THIS ARTICLE
ELLIOTT WAVE
So What's A Bear Market Again?
10/03/11 10:24:09 AMby Koos van der Merwe
In Elliott wave theory, a bear market is usually described as an A-B-C correction.
Position: Buy
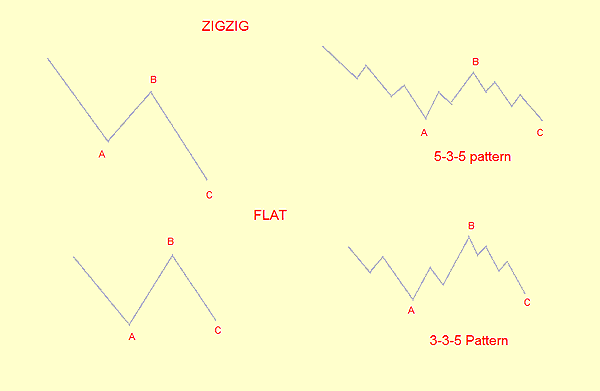
| In a bear market, or any correction for that matter, the correction can either be a 5-3-5 pattern called a zigzag pattern, or a 3-3-5 pattern, which is usually flat. The pattern formation can suggest the strength of the next wave. |

|
| FIGURE 1: PATTERNS. The various patterns an ABC correction can make. |
| Graphic provided by: AdvancedGET. |
| |
| Figure 1 shows the various correction patterns that can occur. Note that wave C in a flat terminates at or just below the end of wave A. This indicates a strong underlying force in the larger trend. They often precede or follow extensions. The longer the flat, the more dynamic the next impulse wave. |

|
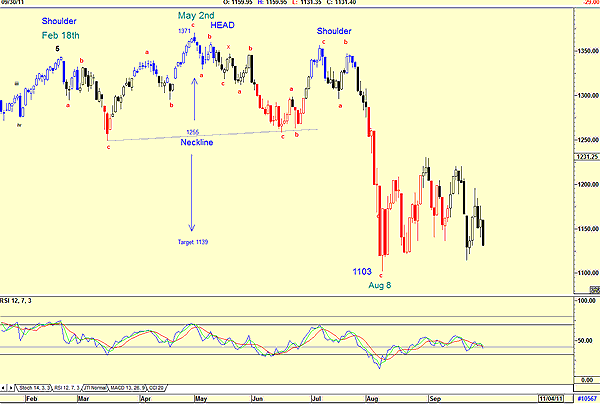
| FIGURE 2: ABC. Here, the ABC corrections since February 18. |
| Graphic provided by: AdvancedGET. |
| |
| Figure 2 is a daily chart of the Standard & Poor's 500 showing what I believe was a wave 5 top on February 18. Many can argue that the top should be on May 2 where the index reached a higher point than that of February 18, but because only a three-wave a-b-c wave count occurred, I have taken February 18 to be the high. This is debatable, but for this article let us use this assumption. The chart shows the A-B-C bear market patterns that have formed since February 18, bottoming in August 8th. Note that a head & shoulders pattern is also there, with a target of 1139 (1371-1255=116. 1255-116=1139). On August 8, the index bottomed at 1103. |

|
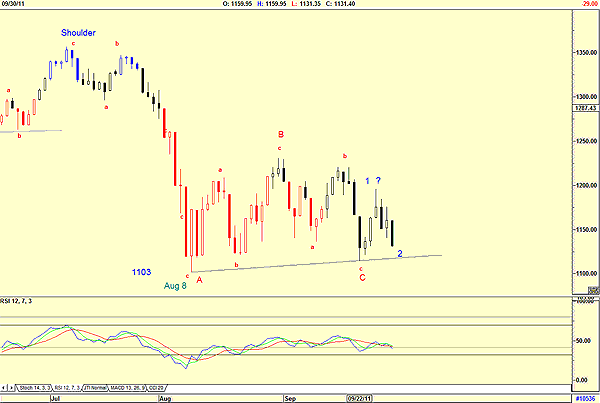
| FIGURE 3: ABC = FLAT? The ABC corrections from August 8 suggest a flat. |
| Graphic provided by: AdvancedGET. |
| |
| Figure 3 is analyzing the wave count from August 8 to the present. The question: Is this a flat correction? If so, can we expect a major and strong upward move? Note that a major wave C ended at a higher level. Wave A definitely suggests that the A-B-C correction is a flat. The high that I have marked with a question mark could therefore be wave 1 and wave 2 of a new bull trend. This is not strong enough, but that remains to be seen over the coming month. October is usually known for horrific corrections. Let us hope that this one will be up, not down. Do note that the relative strength index (RSI) is oversold. |
Has been a technical analyst since 1969, and has worked as a futures and options trader with First Financial Futures in Johannesburg, South Africa.
| Address: | 3256 West 24th Ave |
| Vancouver, BC | |
| Phone # for sales: | 6042634214 |
| E-mail address: | petroosp@gmail.com |
Click here for more information about our publications!
PRINT THIS ARTICLE

Request Information From Our Sponsors
- StockCharts.com, Inc.
- Candle Patterns
- Candlestick Charting Explained
- Intermarket Technical Analysis
- John Murphy on Chart Analysis
- John Murphy's Chart Pattern Recognition
- John Murphy's Market Message
- MurphyExplainsMarketAnalysis-Intermarket Analysis
- MurphyExplainsMarketAnalysis-Visual Analysis
- StockCharts.com
- Technical Analysis of the Financial Markets
- The Visual Investor
- VectorVest, Inc.
- Executive Premier Workshop
- One-Day Options Course
- OptionsPro
- Retirement Income Workshop
- Sure-Fire Trading Systems (VectorVest, Inc.)
- Trading as a Business Workshop
- VectorVest 7 EOD
- VectorVest 7 RealTime/IntraDay
- VectorVest AutoTester
- VectorVest Educational Services
- VectorVest OnLine
- VectorVest Options Analyzer
- VectorVest ProGraphics v6.0
- VectorVest ProTrader 7
- VectorVest RealTime Derby Tool
- VectorVest Simulator
- VectorVest Variator
- VectorVest Watchdog
