HOT TOPICS LIST
- MACD
- Fibonacci
- RSI
- Gann
- ADXR
- Stochastics
- Volume
- Triangles
- Futures
- Cycles
- Volatility
- ZIGZAG
- MESA
- Retracement
- Aroon
INDICATORS LIST
LIST OF TOPICS
PRINT THIS ARTICLE
by Mike Carr, CMT
Stock market volatility is high, as we can see with a chart of the S&P 500 or with the volatility index.
Position: Sell
Mike Carr, CMT
Mike Carr, CMT, is a member of the Market Technicians Association, and editor of the MTA's newsletter, Technically Speaking. He is also the author of "Smarter Investing in Any Economy: The Definitive Guide to Relative Strength Investing," and "Conquering the Divide: How to Use Economic Indicators to Catch Stock Market Trends."
PRINT THIS ARTICLE
CHART ANALYSIS
Volatility With Prices And VIX
10/03/11 09:11:11 AMby Mike Carr, CMT
Stock market volatility is high, as we can see with a chart of the S&P 500 or with the volatility index.
Position: Sell
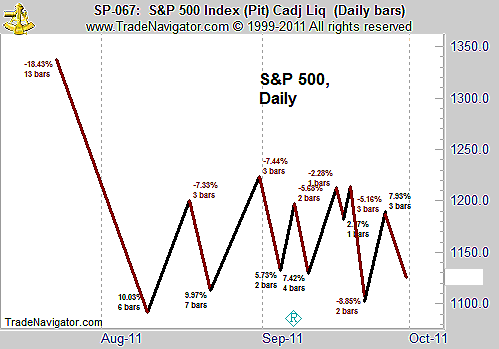
| Without price bars distracting attention, Figure 1 highlights only the fact that stock market volatility has increased significantly in August and September 2011. There have been more than a dozen swings of at least 2% over that time. Those hoping to spot a pattern in the price action are likely to be frustrated, as there just isn't any classic chart pattern visible. |

|
| FIGURE 1: S&P 500, DAILY. The S&P 500 fell sharply during the summer and has spent two months swinging broadly within a large price range. |
| Graphic provided by: Trade Navigator. |
| |
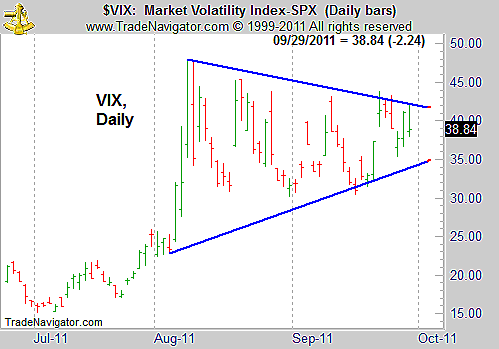
| While percentage price changes help to visualize the volatility, the CBOE Volatility Index (VIX) can also be used. Figure 2 shows that VIX has moved higher during the price decline. VIX levels are about twice as high as they were at the start of the year and have been in a higher range throughout the past two months. We can see a triangle forming in the chart of VIX, which could break out in either direction. |

|
| FIGURE 2: VIX, DAILY. VIX has more than doubled as stocks fell. Traders generally consider a high VIX to be consistent with a market bottom. |
| Graphic provided by: Trade Navigator. |
| |
| Given that VIX is high, stocks may be setting up a broad bottoming pattern. This conclusion is also supported by seasonal patterns. Although October has the reputation of being a crash-filled month, September is actually the weakest month of the year for stock prices. The best six months of the year for stock prices start in November, which offers another seasonal factor favoring a potential bottom in stock prices. |
| The weight of the technical evidence seems to suggest that stocks are likely to form a bottom pattern after the steep summer selloff. |
Mike Carr, CMT, is a member of the Market Technicians Association, and editor of the MTA's newsletter, Technically Speaking. He is also the author of "Smarter Investing in Any Economy: The Definitive Guide to Relative Strength Investing," and "Conquering the Divide: How to Use Economic Indicators to Catch Stock Market Trends."
| Website: | www.moneynews.com/blogs/MichaelCarr/id-73 |
| E-mail address: | marketstrategist@gmail.com |
Click here for more information about our publications!
PRINT THIS ARTICLE

Request Information From Our Sponsors
- StockCharts.com, Inc.
- Candle Patterns
- Candlestick Charting Explained
- Intermarket Technical Analysis
- John Murphy on Chart Analysis
- John Murphy's Chart Pattern Recognition
- John Murphy's Market Message
- MurphyExplainsMarketAnalysis-Intermarket Analysis
- MurphyExplainsMarketAnalysis-Visual Analysis
- StockCharts.com
- Technical Analysis of the Financial Markets
- The Visual Investor
- VectorVest, Inc.
- Executive Premier Workshop
- One-Day Options Course
- OptionsPro
- Retirement Income Workshop
- Sure-Fire Trading Systems (VectorVest, Inc.)
- Trading as a Business Workshop
- VectorVest 7 EOD
- VectorVest 7 RealTime/IntraDay
- VectorVest AutoTester
- VectorVest Educational Services
- VectorVest OnLine
- VectorVest Options Analyzer
- VectorVest ProGraphics v6.0
- VectorVest ProTrader 7
- VectorVest RealTime Derby Tool
- VectorVest Simulator
- VectorVest Variator
- VectorVest Watchdog
