HOT TOPICS LIST
- MACD
- Fibonacci
- RSI
- Gann
- ADXR
- Stochastics
- Volume
- Triangles
- Futures
- Cycles
- Volatility
- ZIGZAG
- MESA
- Retracement
- Aroon
INDICATORS LIST
LIST OF TOPICS
PRINT THIS ARTICLE
by David Penn
In this fable of two double bottoms, the moral is: wait for the breakout.
Position: N/A
David Penn
Technical Writer for Technical Analysis of STOCKS & COMMODITIES magazine, Working-Money.com, and Traders.com Advantage.
PRINT THIS ARTICLE
CHART ANALYSIS
Chart Pattern Failures
04/26/02 09:02:25 AMby David Penn
In this fable of two double bottoms, the moral is: wait for the breakout.
Position: N/A
| There is something in double bottoms that, like double tops, seems almost commonsensical. After all, when a stock or futures contract makes a new major low, rallies over a period of weeks, then endures a correction that successfully tests that previous new major low, most reversal-oriented traders indeed prepare themselves for a reversal and higher prices in the days and weeks to come. This is really all there is to the notion of double bottoms as bullish reversal patterns: a successful test--after a rally of some duration and magnitude--of a previous major low. But not every double bottom turns out to be an accurate reversal pattern. Even successful double bottoms according to Thomas Bulkowski (whose Encyclopedia of Chart Patterns is a valuable guide), feature breakouts only 36% of the time, and often have post-breakout pullbacks that can shake the confidence (and hit the sell-stops) of anxious bottom-feeding traders. So much is this the case that Bulkowski all but recommends that traders and investors wait not only for the successful breakout before going long, but wait for reasonable follow-through as well. |
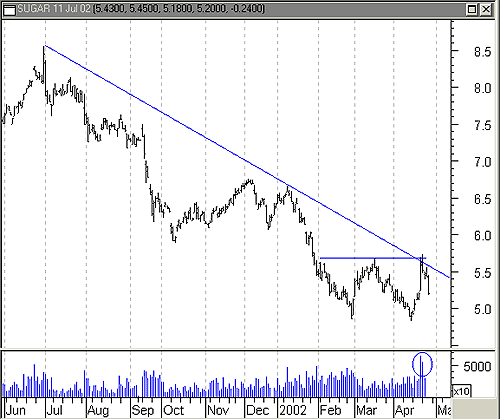
| The pair of double bottoms shown here may prove Bulkowski's caution to have been well founded. I have written about double bottoms in both the July sugar futures contract and in the Dow Jones Utilities Index. While the double bottom in sugar never broke out and has actually retraced 50% of its most recent rally, the Dow Jones Utilities Index remains stuck in a post-breakout malaise. A closer look at the charts of both July sugar and the Dow Jones Utilities Index will suggest that while the double bottom in utilities still has a chance of breaking out on the upside, the double bottom in July sugar truly faces an uphill battle to arrive at its breakout. Let's look at the July sugar contract first. July sugar began its downtrend after peaking just above 8.00 in July 2001. By February 2002, seven months later, July sugar was trading below 5.00, a decline of over 37%. This decline appeared significantly sizeable--in percent decline and duration--to provide for a bottom and possible rally at its conclusion. The first sign of such a bottom comes not with the first rally in February 2002, a rally that topped out at about 5.75, but with the second rally in April which occurred after a correction from the first rally found support just under 5.00. This pair of rallies formed the double bottom in July sugar that suggested a bullish reversal might have been looming. |

|
| Figure 1: Failure to break this downtrend line meant trouble for the breakout from this double bottom. |
| Graphic provided by: MetaStock. |
| |
| However there were three warning signals that any breakout from this double bottom would not come easily. The biggest threat to an upside breakout was in the form of the downtrend line from the July 2001 peak. This downtrend line, which also touched the late December rally high, arrived in the spring of 2002 as significant resistance around 5.80. Another problem with this double bottom had to do with volume. Generally speaking, the higher volume in a double bottom comes on the first trough of the bottom, not the second. In the case of July sugar, the higher volumes are clearly on the side of the second trough. Even though the volume spikes on the up days that complete the double bottom appear significantly bullish, the fact that the tendency of double bottoms is to have higher volume on the earlier trough should have been a warning that the double bottom in July sugar might be less than perfect. Lastly, the top shadows on the candlesticks during the approach to the double bottom's neckline, suggested that buyers were becoming less and less aggressive. While not necessarily a defining characteristic of a failed up move, such top shadows on candlesticks can be a tip that the advance is, even temporarily, running out of steam. |
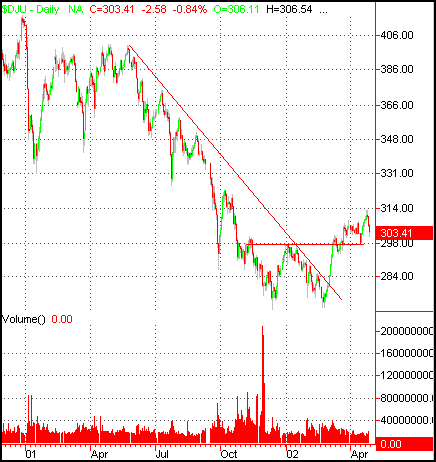
These are among the reasons why many (including Bulkowski) recommend waiting until prices actually break through the neckline before taking a long position based on a double bottom. An even more cautious approach would be to wait for the breakout to retest the neckline for support before going long. The wisdom of such an approach, perhaps, comes from an examination of another recent double bottom in the Dow Jones Utilities Average, which has broken out, if not up. Figure 2: Utilities bulls still have reason to believe in the breakout from this double bottom. Even though the DJUA double bottom has not yet reached its price objective (327, based on a formation bottom of 271 and a neckline of 299), it has already performed far better than the double bottom in July sugar. Note foremost the way that the DJUA entered a downtrend in May 2001 and bottomed with a big volume sell-off in late November. This downtrend took the utilities average down about 24%. From these lows, the DJUA rallied in December, corrected in January and rallied again in February, and it was this price action that formed the double bottom. Unlike the July sugar double bottom, this formation does feature the high volume on the first of the two troughs, which comes from the sell-off. This is, in fact, why the high volume on the first trough is important in double bottoms. The high volume sell-off represents the capitulation of those who had been holding on to utilities stocks during the entire downturn, and who had finally tossed in the towel. |
| Compare also the ways the DJUA and July sugar handled their downtrend line. Where the rally of the bottom in July sugar never broke out on the upside of the downtrend line, the DJUA moved above its downtrend line in late December--even though the Average then tracked the downtrend line downward another 20-odd points. However, when the Average began moving up, it was already above the downtrend line, and no longer had this particular resistance to combat. The fact that the DJUA pulled back after breaking out above the neckline in late February is, if not a positive, at least a familiar characteristic of double bottoms. And as long as prices do not fall back significantly beneath the neckline, then the breakout may still be considered successful. Right now, the key is the way the DJUA negotiates the "Dow Line" (see "Forming a Dow Line," Working-Money.com, February 5, 2002). Support is still at the neckline, around 298, but now a resistance level has been put in place at about 310. |
Technical Writer for Technical Analysis of STOCKS & COMMODITIES magazine, Working-Money.com, and Traders.com Advantage.
| Title: | Technical Writer |
| Company: | Technical Analysis, Inc. |
| Address: | 4757 California Avenue SW |
| Seattle, WA 98116 | |
| Phone # for sales: | 206 938 0570 |
| Fax: | 206 938 1307 |
| Website: | www.Traders.com |
| E-mail address: | DPenn@traders.com |
Traders' Resource Links | |
| Charting the Stock Market: The Wyckoff Method -- Books | |
| Working-Money.com -- Online Trading Services | |
| Traders.com Advantage -- Online Trading Services | |
| Technical Analysis of Stocks & Commodities -- Publications and Newsletters | |
| Working Money, at Working-Money.com -- Publications and Newsletters | |
| Traders.com Advantage -- Publications and Newsletters | |
| Professional Traders Starter Kit -- Software | |
Click here for more information about our publications!
Comments
Date: 04/30/02Rank: 5Comment:
Date: 05/15/02Rank: 5Comment:

Request Information From Our Sponsors
- StockCharts.com, Inc.
- Candle Patterns
- Candlestick Charting Explained
- Intermarket Technical Analysis
- John Murphy on Chart Analysis
- John Murphy's Chart Pattern Recognition
- John Murphy's Market Message
- MurphyExplainsMarketAnalysis-Intermarket Analysis
- MurphyExplainsMarketAnalysis-Visual Analysis
- StockCharts.com
- Technical Analysis of the Financial Markets
- The Visual Investor
- VectorVest, Inc.
- Executive Premier Workshop
- One-Day Options Course
- OptionsPro
- Retirement Income Workshop
- Sure-Fire Trading Systems (VectorVest, Inc.)
- Trading as a Business Workshop
- VectorVest 7 EOD
- VectorVest 7 RealTime/IntraDay
- VectorVest AutoTester
- VectorVest Educational Services
- VectorVest OnLine
- VectorVest Options Analyzer
- VectorVest ProGraphics v6.0
- VectorVest ProTrader 7
- VectorVest RealTime Derby Tool
- VectorVest Simulator
- VectorVest Variator
- VectorVest Watchdog
