HOT TOPICS LIST
- MACD
- Fibonacci
- RSI
- Gann
- ADXR
- Stochastics
- Volume
- Triangles
- Futures
- Cycles
- Volatility
- ZIGZAG
- MESA
- Retracement
- Aroon
INDICATORS LIST
LIST OF TOPICS
PRINT THIS ARTICLE
by Koos van der Merwe
Cycles can be something of a mystery.
Position: Accumulate
Koos van der Merwe
Has been a technical analyst since 1969, and has worked as a futures and options trader with First Financial Futures in Johannesburg, South Africa.
PRINT THIS ARTICLE
CYCLES
The Puzzling Paget And His Cycles
10/03/11 09:06:23 AMby Koos van der Merwe
Cycles can be something of a mystery.
Position: Accumulate
| Students of technical analysis have always believed in the importance and accuracy of cycles. Many have wondered why cycles occur. Is it planetary gravitational influence of the emotions of traders, or is it simply that time of the month and cyclical mental exhaustion? W.D Gann spent years studying the planetary influence of cycles. Because of my articles on the K-wave in Stocks & Commodities magazine, a gentleman named Alan Richter has sent me letters and two articles on cyclical analysis from his book, "The Investment Astrology Articles." I spent many years studying Gann's charts on the planetary influence on the market, but decided to stick to simplicity. I do watch the solstices and equinoxes, but above all I watch the simple cycle bottoms, not trying to determine the whys and wherefores. However, I also watch the cyclical analysis of a person I met in the 1970s, a man by the name of Roger Paget. |

|
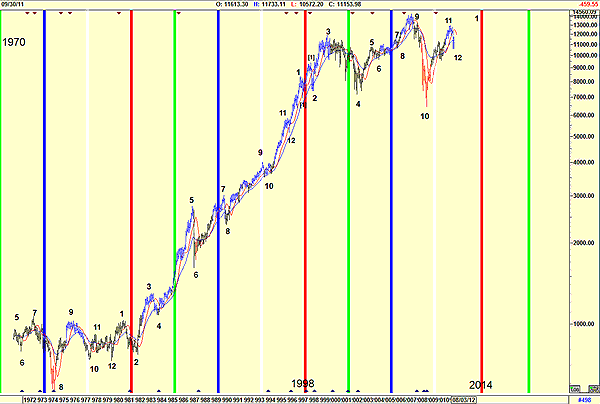
| FIGURE 1: PAGET'S CYCLE |
| Graphic provided by: AdvancedGET. |
| |
| My logarithmic chart of the Dow Jones Industrial Average (Figure 1) shows Paget's theory, namely that every four years a cyclical pattern is repeated. The chart shows the different-colored vertical lines repeated every four years, and the pattern the DJIA tends to follow. The high before the red vertical line will be #1, with #12 bottoming sometime between July and September 2011. The chart is now suggesting that the DJIA should start moving up into sometime before the end of 2013 before the next major correction. The fact that this pattern has been true since 1970 makes it believable. Paget's chart is suggesting that within the next few months, the DJIA should start moving up until the end of 2013 once a solution to the present world economic uncertainty has been made. The chart is suggesting that this could be soon. |
Has been a technical analyst since 1969, and has worked as a futures and options trader with First Financial Futures in Johannesburg, South Africa.
| Address: | 3256 West 24th Ave |
| Vancouver, BC | |
| Phone # for sales: | 6042634214 |
| E-mail address: | petroosp@gmail.com |
Click here for more information about our publications!
PRINT THIS ARTICLE

Request Information From Our Sponsors
- StockCharts.com, Inc.
- Candle Patterns
- Candlestick Charting Explained
- Intermarket Technical Analysis
- John Murphy on Chart Analysis
- John Murphy's Chart Pattern Recognition
- John Murphy's Market Message
- MurphyExplainsMarketAnalysis-Intermarket Analysis
- MurphyExplainsMarketAnalysis-Visual Analysis
- StockCharts.com
- Technical Analysis of the Financial Markets
- The Visual Investor
- VectorVest, Inc.
- Executive Premier Workshop
- One-Day Options Course
- OptionsPro
- Retirement Income Workshop
- Sure-Fire Trading Systems (VectorVest, Inc.)
- Trading as a Business Workshop
- VectorVest 7 EOD
- VectorVest 7 RealTime/IntraDay
- VectorVest AutoTester
- VectorVest Educational Services
- VectorVest OnLine
- VectorVest Options Analyzer
- VectorVest ProGraphics v6.0
- VectorVest ProTrader 7
- VectorVest RealTime Derby Tool
- VectorVest Simulator
- VectorVest Variator
- VectorVest Watchdog
