HOT TOPICS LIST
- MACD
- Fibonacci
- RSI
- Gann
- ADXR
- Stochastics
- Volume
- Triangles
- Futures
- Cycles
- Volatility
- ZIGZAG
- MESA
- Retracement
- Aroon
INDICATORS LIST
LIST OF TOPICS
PRINT THIS ARTICLE
by Matt Blackman
These have been tough times for the banking sector. But there may be some light at the end of the tunnel.
Position: N/A
Matt Blackman
Matt Blackman is a full-time technical and financial writer and trader. He produces corporate and financial newsletters, and assists clients in getting published in the mainstream media. He is the host of TradeSystemGuru.com. Matt has earned the Chartered Market Technician (CMT) designation. Find out what stocks and futures Matt is watching on Twitter at www.twitter.com/RatioTrade
PRINT THIS ARTICLE
WEDGE FORMATIONS
Light At The End Of The Tunnel For BAC?
10/03/11 08:34:59 PMby Matt Blackman
These have been tough times for the banking sector. But there may be some light at the end of the tunnel.
Position: N/A
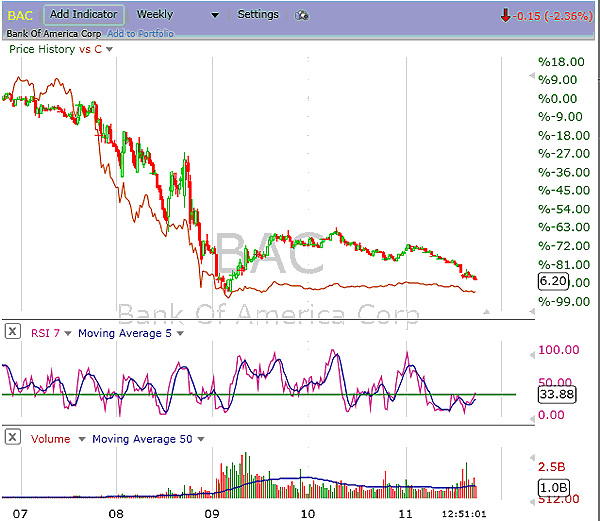
| It's been tough time for banks since the financial crisis. As Figure 1 shows, Bank of America (BAC) is down 90% and Citigroup down around 96%. Those who looked to TARP and other bailout programs to put a floor under financial stocks in 2008 have paid for their optimism. And although stock prices are still above their early 2009 lows, this has been another tough year: BAC is down 56% on 2011 so far. |

|
| FIGURE 1: BAC, WEEKLY. Weekly chart of Bank of America (BAC) and Citigroup (C) since the peak in October 2007. |
| Graphic provided by: FreeStockCharts.com. |
| |
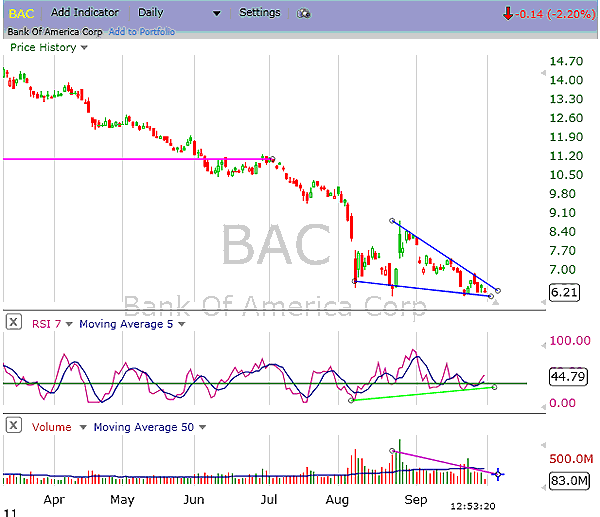
| But a closer look at the BAC chart shows an interesting pattern emerging. First, Figure 2 shows that volume has put in two spikes that could be showing investor capitulation. We then see a gap before a lower low was hit in August, and after a brief rally, the stock dropped to another low but on less selling volume. It was hovering around its lows at the end of September 2011, creating a pattern that has all the makings of a bullish falling wedge. |

|
| FIGURE 2: BAC, DAILY. The daily chart of BAC showing the strong downtrend, but a promising-looking bullish falling wedge chart pattern with supporting volume and positively diverging relative strength index (RSI). |
| Graphic provided by: FreeStockCharts.com. |
| |
| Although this doesn't necessarily mean BAC has hit THE bottom, it could well be at A bottom and due for a bounce in spite of the legal troubles the bank is encountering. |
| This is another example of how technicals lead fundamentals. Value investors who can't read charts tend to buy a stock as price falls because it gets "cheaper" on a valuation basis. But the risk of this habit is that it motivates buying distressed stocks that never recover. But perhaps the biggest fundamental positive for BAC is that Warren Buffett has been buying it. |
| Regardless of what fundamentals are telling you, waiting for a reversal pattern to appear and buying once a buy signal occurs (the upper trendline is broken on rising buying volume) greatly increases the potential of entering a profitable trade. But it is essential that a stop-loss be set to protect principal and then raised to protect profits once the trade starts making money. |
Matt Blackman is a full-time technical and financial writer and trader. He produces corporate and financial newsletters, and assists clients in getting published in the mainstream media. He is the host of TradeSystemGuru.com. Matt has earned the Chartered Market Technician (CMT) designation. Find out what stocks and futures Matt is watching on Twitter at www.twitter.com/RatioTrade
| Company: | TradeSystemGuru.com |
| Address: | Box 2589 |
| Garibaldi Highlands, BC Canada | |
| Phone # for sales: | 604-898-9069 |
| Fax: | 604-898-9069 |
| Website: | www.tradesystemguru.com |
| E-mail address: | indextradermb@gmail.com |
Traders' Resource Links | |
| TradeSystemGuru.com has not added any product or service information to TRADERS' RESOURCE. | |
Click here for more information about our publications!
PRINT THIS ARTICLE

Request Information From Our Sponsors
- VectorVest, Inc.
- Executive Premier Workshop
- One-Day Options Course
- OptionsPro
- Retirement Income Workshop
- Sure-Fire Trading Systems (VectorVest, Inc.)
- Trading as a Business Workshop
- VectorVest 7 EOD
- VectorVest 7 RealTime/IntraDay
- VectorVest AutoTester
- VectorVest Educational Services
- VectorVest OnLine
- VectorVest Options Analyzer
- VectorVest ProGraphics v6.0
- VectorVest ProTrader 7
- VectorVest RealTime Derby Tool
- VectorVest Simulator
- VectorVest Variator
- VectorVest Watchdog
- StockCharts.com, Inc.
- Candle Patterns
- Candlestick Charting Explained
- Intermarket Technical Analysis
- John Murphy on Chart Analysis
- John Murphy's Chart Pattern Recognition
- John Murphy's Market Message
- MurphyExplainsMarketAnalysis-Intermarket Analysis
- MurphyExplainsMarketAnalysis-Visual Analysis
- StockCharts.com
- Technical Analysis of the Financial Markets
- The Visual Investor
