HOT TOPICS LIST
- MACD
- Fibonacci
- RSI
- Gann
- ADXR
- Stochastics
- Volume
- Triangles
- Futures
- Cycles
- Volatility
- ZIGZAG
- MESA
- Retracement
- Aroon
INDICATORS LIST
LIST OF TOPICS
PRINT THIS ARTICLE
by Billy Williams
Market breakdowns occur as fast as you can blink, but if you know the signs of a breakdown, you can emerge a winner.
Position: Sell
Billy Williams
Billy Williams has been trading the markets for 27 years, specializing in momentum trading with stocks and options.
PRINT THIS ARTICLE
STRATEGIES
Four Signs Of A Market Breakdown
09/30/11 09:43:21 AMby Billy Williams
Market breakdowns occur as fast as you can blink, but if you know the signs of a breakdown, you can emerge a winner.
Position: Sell
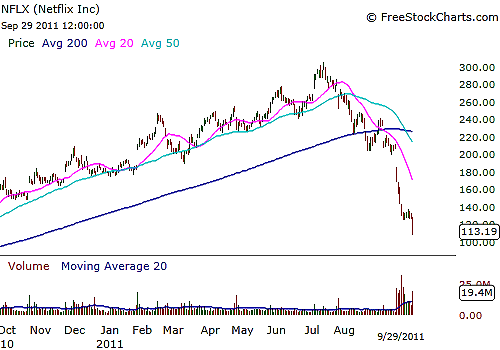
| When the stock market is in trouble, it can be hard to distinguish among a minor pullback, price consolidation, and a correction. The ability to read what is going on in the market by closely observing price action cannot only keep you from taking a major loss but prevent you from getting completely wiped out. Traders of every experience level often have trouble reading when the market is going to break down and stay in a position too long, which is often too late by the time they realize what is going on. Fortunately, there are four technical signs that can reveal when the market is experiencing trouble and when it is time to sidestep a massive decline that could devastate your trading capital. The first thing to observe is trading volume. Price and volume have a strong relationship to each other, as volume is the fuel that drives price either up or down. When selling volume begins to enter the market and trend higher, it is an indication that investors are beginning to flee the market and result in the bears seizing control of the market direction. See Figure 1. |

|
| FIGURE 1: NETFLIX. Netflix was a strong leader in the stock market until its bullish trend began to falter and price stalled until it eventually broke down like other leaders in the market. This sign helped signal that an overall market breakdown was in the making. |
| Graphic provided by: www.freestockcharts.com. |
| |
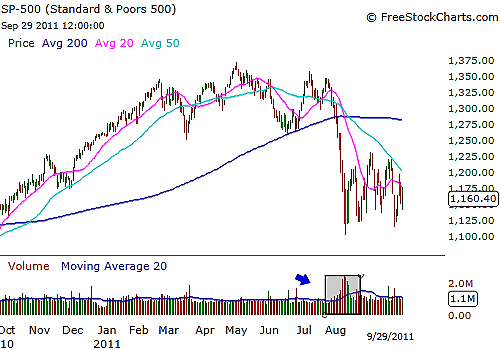
| The second sign to keep an eye out for is when the identified stock leaders begin to weaken and break down. Stock leadership is responsible for taking the overall market higher, based on the sheer strength that their price action reflects. When that price action begins to weaken and break down, then it is a sure sign that the market is in trouble. You want to observe these stocks and note when they begin to falter as a group because once they fail to go higher, they will reverse course and lead the market down. Next, you'll want to observe if the market undergoes distribution. See Figure 2. |

|
| FIGURE 2: SPX. The SPX had a steep selloff that was marked by high selling volume that steadily climbed higher, signaling that the market breakdown was near. |
| Graphic provided by: www.freestockcharts.com. |
| |
| A distribution day is often noted on two occasions -- first, when price declines greater than 1% or more in a major index like the Standard & Poor's 500 and is accompanied by greater total volume than the previous trading day. The second occasion is when price trades near a significant high and the price open and close for the trading day end up being at or near the same price level on greater volume than the previous trading day. |
| Both types of trading days signify that sellers are selling as buyers rush in to help mask their distribution of shares. This is done by major trading institutions so they can get out at the best possible price without alerting the trading community at large. The final thing you want to make sure that you track is the new highs/new lows in the market. Typically, you can get this from any financial periodical like the "Investor's Business Daily," where the number of stocks that are reaching new price highs are recorded along with the stocks that are reaching new lows in price. |
| This is important because when a market is healthy and reaching higher highs and higher lows in price, stocks tend to follow this pattern and go on to register new price highs as they trend upward. However, the opposite occurs when a market is breaking down where stock records greater numbers of price lows as the market breaks down. By being mindful of these signs of a market breakdown, you can approach the market with a greater sense of when to tighten your stops, take profits, adjust your position, or sidestep a steep market decline. In addition, they will also give you an indication of when to reverse your position and take a bearish approach to the markets to exploit these steep selloffs for profit when other investors panic as the market breaks down. |
Billy Williams has been trading the markets for 27 years, specializing in momentum trading with stocks and options.
| Company: | StockOptionSystem.com |
| E-mail address: | stockoptionsystem.com@gmail.com |
Traders' Resource Links | |
| StockOptionSystem.com has not added any product or service information to TRADERS' RESOURCE. | |
Click here for more information about our publications!
Comments
Date: 10/01/11Rank: 5Comment:

|

Request Information From Our Sponsors
- VectorVest, Inc.
- Executive Premier Workshop
- One-Day Options Course
- OptionsPro
- Retirement Income Workshop
- Sure-Fire Trading Systems (VectorVest, Inc.)
- Trading as a Business Workshop
- VectorVest 7 EOD
- VectorVest 7 RealTime/IntraDay
- VectorVest AutoTester
- VectorVest Educational Services
- VectorVest OnLine
- VectorVest Options Analyzer
- VectorVest ProGraphics v6.0
- VectorVest ProTrader 7
- VectorVest RealTime Derby Tool
- VectorVest Simulator
- VectorVest Variator
- VectorVest Watchdog
- StockCharts.com, Inc.
- Candle Patterns
- Candlestick Charting Explained
- Intermarket Technical Analysis
- John Murphy on Chart Analysis
- John Murphy's Chart Pattern Recognition
- John Murphy's Market Message
- MurphyExplainsMarketAnalysis-Intermarket Analysis
- MurphyExplainsMarketAnalysis-Visual Analysis
- StockCharts.com
- Technical Analysis of the Financial Markets
- The Visual Investor
