

HOT TOPICS LIST
- MACD
- Fibonacci
- RSI
- Gann
- ADXR
- Stochastics
- Volume
- Triangles
- Futures
- Cycles
- Volatility
- ZIGZAG
- MESA
- Retracement
- Aroon
INDICATORS LIST
LIST OF TOPICS
PRINT THIS ARTICLE
by Alan R. Northam
Caterpillar beaten down by the bears?
Position: N/A
Alan R. Northam
Alan Northam lives in the Dallas, Texas area and as an electronic engineer gave him an analytical mind from which he has developed a thorough knowledge of stock market technical analysis. His abilities to analyze the future direction of the stock market has allowed him to successfully trade of his own portfolio over the last 30 years. Mr. Northam is now retired and trading the stock market full time. You can reach him at inquiry@tradersclassroom.com or by visiting his website at http://www.tradersclassroom.com. You can also follow him on Twitter @TradersClassrm.
PRINT THIS ARTICLE
STATISTICS
Caterpillar Bear Market
09/29/11 02:24:35 PMby Alan R. Northam
Caterpillar beaten down by the bears?
Position: N/A
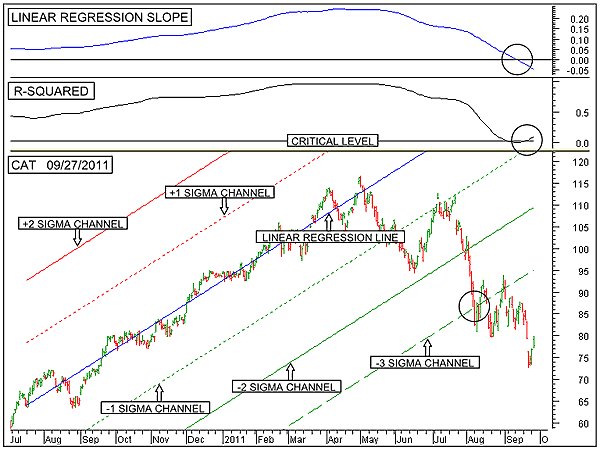
| The lower panel of Figure 1 shows the long-term statistical analysis of Caterpillar (CAT). This figure shows the 200-day linear regression trendline (solid blue line), the upper one sigma channel line (dotted red line), the upper two sigma channel line (solid red line), the lower one sigma channel line (dotted green line), the lower two sigma channel line (solid green line), and the lower three sigma channel line (dashed green line). Besides their statistical significance, the red channel lines act as resistance and the green channel lines support. |
|
| FIGURE 1: CAT, DAILY. This chart shows the daily price chart of Caterpillar in the lower panel along with its upward sloping 200-day linear regression trendline and its associated upper and lower channel lines. The top panel shows the linear regression slope indicator, followed by the R-squared indicator. This chart shows Caterpillar breaking down below the lower three sigma channel line in early August 2011 to begin a primary bear market trend. |
| Graphic provided by: MetaStock. |
| |
| Note that from early July 2010 through late April 2011, price hugged the linear regression trendline and did not come close to touching either the upper one sigma channel line nor the lower one sigma channel line. This tight hugging action is a statistical sign of a very strong trend. Then in late May 2011, price broke down below the lower one sigma channel line. While this is not a sign of a change in trend, it is a sign of a secondary reaction. Normally, there are two secondary reactions during a market trend, and since price had been moving upward for more than a year, this secondary reaction would naturally be considered the second secondary reaction to the primary trend. Further, this means that there should be one more higher high before the primary trend ends. In mid-June, the final rally began. However, as can be seen from the chart, the final rally failed at the lower one sigma channel line and price turned down. Charles Henry Dow wrote that while there are typically two secondary reactions within a primary trend, they can also be deceiving, because at times, these secondary reactions can be the first downleg of a primary bear market. In the current case, this second secondary reaction was a deceiver. |
| In early August, CAT went on to break down below the lower two sigma channel line to warn of a possible reversal in trend from a long-term primary bull market to a primary bear market. A few days later, CAT broke down below the lower three sigma channel line to signal that a reversal in trend was at hand. |
| In looking at the linear regression slope indicator in the top panel of Figure 1, note that this indicator is now below its zero line, indicating that the primary trend is now downward. The next lower panel shows the R-squared indicator moved above its critical level, indicating a 95% confidence level that this new primary bear market trend will continue. |
| In conclusion, this statistical analysis shows that the primary bull market trend of Caterpillar has come to an end and a new primary bear market trend has been established. As long as the linear regression slope indicator continues to move downward below its zero line and the R-squared indicator continues to move upward above its critical level, the bear market trend will continue. |
Alan Northam lives in the Dallas, Texas area and as an electronic engineer gave him an analytical mind from which he has developed a thorough knowledge of stock market technical analysis. His abilities to analyze the future direction of the stock market has allowed him to successfully trade of his own portfolio over the last 30 years. Mr. Northam is now retired and trading the stock market full time. You can reach him at inquiry@tradersclassroom.com or by visiting his website at http://www.tradersclassroom.com. You can also follow him on Twitter @TradersClassrm.
| Garland, Tx | |
| Website: | www.tradersclassroom.com |
| E-mail address: | inquiry@tradersclassroom.com |
Click here for more information about our publications!
PRINT THIS ARTICLE

Request Information From Our Sponsors
- VectorVest, Inc.
- Executive Premier Workshop
- One-Day Options Course
- OptionsPro
- Retirement Income Workshop
- Sure-Fire Trading Systems (VectorVest, Inc.)
- Trading as a Business Workshop
- VectorVest 7 EOD
- VectorVest 7 RealTime/IntraDay
- VectorVest AutoTester
- VectorVest Educational Services
- VectorVest OnLine
- VectorVest Options Analyzer
- VectorVest ProGraphics v6.0
- VectorVest ProTrader 7
- VectorVest RealTime Derby Tool
- VectorVest Simulator
- VectorVest Variator
- VectorVest Watchdog
- StockCharts.com, Inc.
- Candle Patterns
- Candlestick Charting Explained
- Intermarket Technical Analysis
- John Murphy on Chart Analysis
- John Murphy's Chart Pattern Recognition
- John Murphy's Market Message
- MurphyExplainsMarketAnalysis-Intermarket Analysis
- MurphyExplainsMarketAnalysis-Visual Analysis
- StockCharts.com
- Technical Analysis of the Financial Markets
- The Visual Investor