HOT TOPICS LIST
- MACD
- Fibonacci
- RSI
- Gann
- ADXR
- Stochastics
- Volume
- Triangles
- Futures
- Cycles
- Volatility
- ZIGZAG
- MESA
- Retracement
- Aroon
INDICATORS LIST
LIST OF TOPICS
PRINT THIS ARTICLE
by Koos van der Merwe
Hewlett Packard seems to have a penchant of firing its CEOs. What's that do to its stock?
Position: Hold
Koos van der Merwe
Has been a technical analyst since 1969, and has worked as a futures and options trader with First Financial Futures in Johannesburg, South Africa.
PRINT THIS ARTICLE
GAPS
Hewlett Packard's Penchant
09/28/11 10:04:09 AMby Koos van der Merwe
Hewlett Packard seems to have a penchant of firing its CEOs. What's that do to its stock?
Position: Hold
| On August 6, 2010, Mark V. Hurd, Hewlett Packard's (HPQ) chairman and chief executive, was ousted from his post. His replacement was Leo Apotheker, who in turn was replaced by Meg Whitman the following year, on September 22, 2011. Whitman has stated that Apotheker's strategy of spinning off HP's personal computer business from other parts of the company will likely remain in place. Will Whitman bring the company back to its former glory? Only time will tell, but the charts are worth looking at. |

|
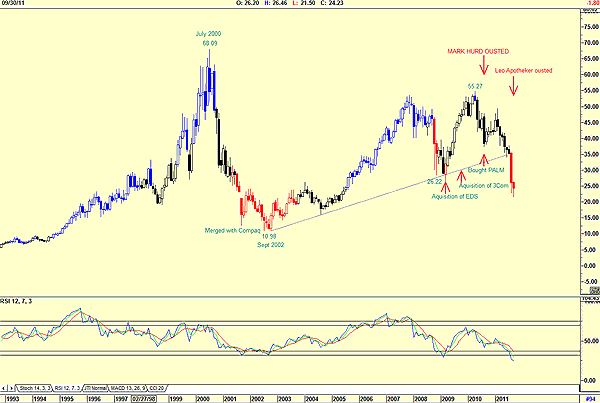
| FIGURE 1: HPQ, MONTHLY |
| Graphic provided by: AdvancedGET. |
| |
| Figure 1, the monthly chart, shows how the price reached a high of $68.09 in July 2000, then as the technology bubble burst, the price of the shares fell to a low of $10.98 by September 2002, an ominous drop hinting at the future uncertainty within the management of the company. In 2002, the company merged with Compaq, and in 2008, it acquired EDS. In 2009, it purchased 3Com, and in April 2010, the company purchased PALM. The question is, what was the plan? The chart shows the stock moved after each purchase, and it doesn't look as if they were that successful, although the acquisition of EDS did see a price rise to $55.27 from a low of $26.22. Either Hewlett Packard had too much cash on hand and did not know what they wanted to do with it, because they lacked the inventive imagination of a Steve Jobs. At the moment, the chart has a relative strength index (RSI) that is oversold, so there is the possibility that Meg Whitman could be successful in her turn at the job. |

|
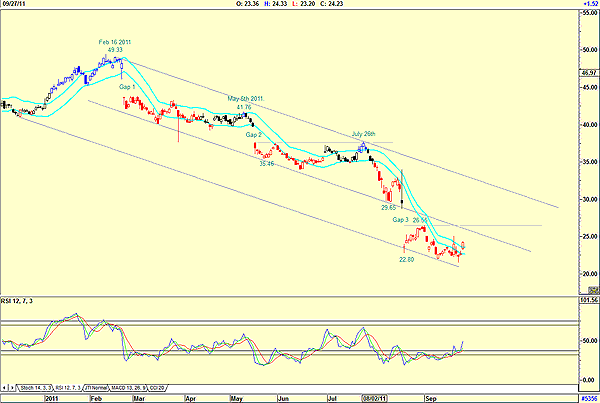
| FIGURE 2: HPQ, DAILY |
| Graphic provided by: AdvancedGET. |
| |
| Figure 2, the daily chart, shows how the share price dropped from $49.33 on February 16, 2011, on a gap. The rule is that a share will then rise to fill the gap. This did not happen. The share price moved sideways until May 5 and then once again fell on a gap to $35.46. Once again, we would have expected the share to rise and fill the gap. Once again, this did not happen, with the share price falling to the support line at $29.65 and then falling for a third time on a gap to a low of $22.80. In all cases the RSI was oversold, suggesting a buy signal. Once again the RSI has given a buy signal. Will the price now rise to test the $26.56 pivot resistance? And hopefully break it, filling gap 3? One thing in Whitman's favor is that the price has given a buy signal on the JM internal band. We have to wait and see whether this signal will hold. Although Hewlett Packard is a solid company, management in trying to reinvent the company has caused the share price to underperform. With its new present management, I would only buy the share should it move above the $26.55 level. Previous JM internal band buy signals were not that successful. |
Has been a technical analyst since 1969, and has worked as a futures and options trader with First Financial Futures in Johannesburg, South Africa.
| Address: | 3256 West 24th Ave |
| Vancouver, BC | |
| Phone # for sales: | 6042634214 |
| E-mail address: | petroosp@gmail.com |
Click here for more information about our publications!
PRINT THIS ARTICLE

Request Information From Our Sponsors
- VectorVest, Inc.
- Executive Premier Workshop
- One-Day Options Course
- OptionsPro
- Retirement Income Workshop
- Sure-Fire Trading Systems (VectorVest, Inc.)
- Trading as a Business Workshop
- VectorVest 7 EOD
- VectorVest 7 RealTime/IntraDay
- VectorVest AutoTester
- VectorVest Educational Services
- VectorVest OnLine
- VectorVest Options Analyzer
- VectorVest ProGraphics v6.0
- VectorVest ProTrader 7
- VectorVest RealTime Derby Tool
- VectorVest Simulator
- VectorVest Variator
- VectorVest Watchdog
- StockCharts.com, Inc.
- Candle Patterns
- Candlestick Charting Explained
- Intermarket Technical Analysis
- John Murphy on Chart Analysis
- John Murphy's Chart Pattern Recognition
- John Murphy's Market Message
- MurphyExplainsMarketAnalysis-Intermarket Analysis
- MurphyExplainsMarketAnalysis-Visual Analysis
- StockCharts.com
- Technical Analysis of the Financial Markets
- The Visual Investor
