HOT TOPICS LIST
- MACD
- Fibonacci
- RSI
- Gann
- ADXR
- Stochastics
- Volume
- Triangles
- Futures
- Cycles
- Volatility
- ZIGZAG
- MESA
- Retracement
- Aroon
INDICATORS LIST
LIST OF TOPICS
PRINT THIS ARTICLE
by David Penn
Cocoa's up and sugar's down ... but how long will these trends remain in place?
Position: N/A
David Penn
Technical Writer for Technical Analysis of STOCKS & COMMODITIES magazine, Working-Money.com, and Traders.com Advantage.
PRINT THIS ARTICLE
MOMENTUM
Relative Momentum Index
04/22/02 02:41:14 PMby David Penn
Cocoa's up and sugar's down ... but how long will these trends remain in place?
Position: N/A
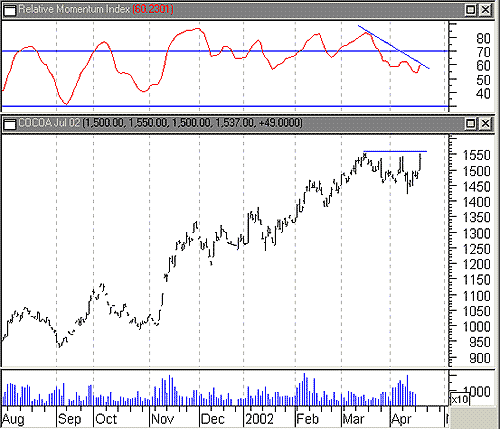
| Cocoa has been one of the bullish success stories among commodities. Since moving up from a bottom in December 2000 at 711, cocoa prices soared 68% to a high of 1196 two months later. And even though cocoa spent most of 2001 taking back that late 2000 run, falling to a low of 861 in September 2001, a longer-term uptrend was restored, one that was more sustainable than the quick ramping up that took place during the December 2000-February 2001 jump. This uptrend connects the lows of December 2000 with the September 2001 correction low and a subsequent, higher correction low in November. The second leg of the cocoa bull market, which began in September 2001, has been even more impressive than the first--if significantly longer: cocoa is up more than 80% from the September 2001 correction low. |
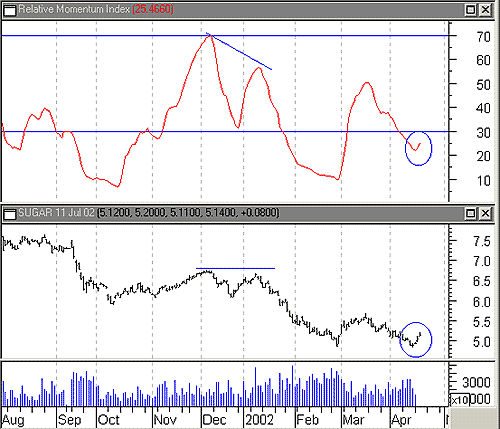
| Sugar, on the other hand, has been working its way downward in a series of volatile spikes and corrections for the past few years. Compared to cocoa's extended trends and clear countertrends, the continuous futures for sugar look at first glance to be all over the place. Nevertheless, sugar has been making lower highs and lower lows. The most recent major lower low was the February 2002 low of 5.13, from which sugar rallied 24% by mid-March. However, sugar looks to have established a higher low in early April with the correction low (thus far) of 5.46. Such a higher low would be the first precursor to a new bull market in sugar should the April low hold. |

|
| Figure 1: This negative divergence in the RMI could mean a correction is near for July cocoa. |
| Graphic provided by: MetaStock. |
| |
| That technical history said, I want to use the Relative Momentum Index to further interpret where both cocoa and sugar are and, possibly, decipher where each may be headed in the weeks to come. The Relative Momentum Index was first introduced in the pages of Stocks & Commodities magazine in 1993 by Roger Altman, whose article "Relative Momentum Index: Modifying RSI" made the case for an indicator that has many of the strengths of the Relative Strength Index (after which it is both named and based) and fewer of its weaknesses. Specifically, Altman was looking for a less erratic oscillation between overbought and oversold levels and, by adding an additional parameter to the Relative Strength Index, was able to achieve this in his Relative Momentum Index or RMI. Where the Relative Strength Index counts up and down closes on a day-to-day fashion, the Relative Momentum Index counts up and down closes relative to the close X-number of periods ago. Importantly, as Altman noted, this X-number need not be one. In fact, when the X-number is one, a 20-day Relative Momentum Index is virtually the same as the 20-day Relative Strength Index. It is when the X-number is larger, three or five, that the effectiveness of the Relative Momentum Index begins to exceed that of the traditional RSI for many traders. This is particularly the case when the RMI is used to gauge the possibility of a reversal - in other words, a major shift in momentum. |
| This is one of the reasons to deploy the RMI on the long-upwardly trending cocoa market and on a sugar market that looks to be establishing a bottom. In the first case, with cocoa, we see how the RMI remained largely in overbought territory during July cocoa's advance from November 2001 to March 2002. But what is most striking about this chart is the major negative divergence between the RMI in March and April and cocoa prices during the same period. Generally speaking, much like RSI, overbought and oversold levels on the RMI are above 70 and under 30. And trading signals can be generated from these oscillations in the RMI. But another way of using the RMI, much like the RSI, is to look for negative and positive divergences between the indicator and price action. Whether the negative divergence between the RMI and cocoa is anticipating a severe correction or a mild drop down to one of the nearby support areas, traders who are long cocoa should watch closely for any signs of weakness in prices. |
 Figure 2: An uptick in the RMI confirms July sugar's move off the bottom--so far. Sugar, on the other hand, has already suffered through the consequences of a negative divergence. After a decline from 7.33 in August 2001 to about 6.00, sugar put in to minor highs during rallies in the month of November 2001 and January 2002. While these highs were almost the same in height, the relative momentum index was far lower on the second peak than was its reading on the first. This set up a classic negative divergence scenario to which sugar prices soon succumbed. Near the end of January 2002, sugar prices fell from about 6.00 to about 4.85 by the end of February, a loss of 20%. Currently, however, the RMI is starting to curl upward toward the zero line, and sugar prices are climbing again. After testing the February lows with an April low of 4.83, sugar shot up to 5.20 in a few days. Should the RMI continue to move upward, penetrating the zero line, that would serve as strong confirmation that a new bull trend in sugar may be underway. Incidentally, I can't help but mention the possibility of a double bottom in July sugar (SN2). With a low around 4.60 and a neckline at about 5.60, the upside target for a successful breakout is 6.60. The sizeable volume on Tuesday and Wednesday (both up days) is also supportive of the new advance in July sugar. |
Technical Writer for Technical Analysis of STOCKS & COMMODITIES magazine, Working-Money.com, and Traders.com Advantage.
| Title: | Technical Writer |
| Company: | Technical Analysis, Inc. |
| Address: | 4757 California Avenue SW |
| Seattle, WA 98116 | |
| Phone # for sales: | 206 938 0570 |
| Fax: | 206 938 1307 |
| Website: | www.Traders.com |
| E-mail address: | DPenn@traders.com |
Traders' Resource Links | |
| Charting the Stock Market: The Wyckoff Method -- Books | |
| Working-Money.com -- Online Trading Services | |
| Traders.com Advantage -- Online Trading Services | |
| Technical Analysis of Stocks & Commodities -- Publications and Newsletters | |
| Working Money, at Working-Money.com -- Publications and Newsletters | |
| Traders.com Advantage -- Publications and Newsletters | |
| Professional Traders Starter Kit -- Software | |
Click here for more information about our publications!
Comments
Date: 04/28/02Rank: 5Comment:

Request Information From Our Sponsors
- StockCharts.com, Inc.
- Candle Patterns
- Candlestick Charting Explained
- Intermarket Technical Analysis
- John Murphy on Chart Analysis
- John Murphy's Chart Pattern Recognition
- John Murphy's Market Message
- MurphyExplainsMarketAnalysis-Intermarket Analysis
- MurphyExplainsMarketAnalysis-Visual Analysis
- StockCharts.com
- Technical Analysis of the Financial Markets
- The Visual Investor
- VectorVest, Inc.
- Executive Premier Workshop
- One-Day Options Course
- OptionsPro
- Retirement Income Workshop
- Sure-Fire Trading Systems (VectorVest, Inc.)
- Trading as a Business Workshop
- VectorVest 7 EOD
- VectorVest 7 RealTime/IntraDay
- VectorVest AutoTester
- VectorVest Educational Services
- VectorVest OnLine
- VectorVest Options Analyzer
- VectorVest ProGraphics v6.0
- VectorVest ProTrader 7
- VectorVest RealTime Derby Tool
- VectorVest Simulator
- VectorVest Variator
- VectorVest Watchdog
