HOT TOPICS LIST
- MACD
- Fibonacci
- RSI
- Gann
- ADXR
- Stochastics
- Volume
- Triangles
- Futures
- Cycles
- Volatility
- ZIGZAG
- MESA
- Retracement
- Aroon
INDICATORS LIST
LIST OF TOPICS
PRINT THIS ARTICLE
by Austin Passamonte
Here's the midterm outlook for the Standard & Poor's 500 index.
Position: N/A
Austin Passamonte
Austin is a private trader who trades emini stock index futures intraday. He currently trades various futures markets from home in addition to managing a trader's educational forum
PRINT THIS ARTICLE
TECHNICAL ANALYSIS
Flag Day?
09/27/11 09:54:08 AMby Austin Passamonte
Here's the midterm outlook for the Standard & Poor's 500 index.
Position: N/A
| The US stock index markets are said to have entered bear market territory after having fallen from recent peak highs to recent swing lows. But that movement has not been in a straight line or even in a deliberate trend. |

|
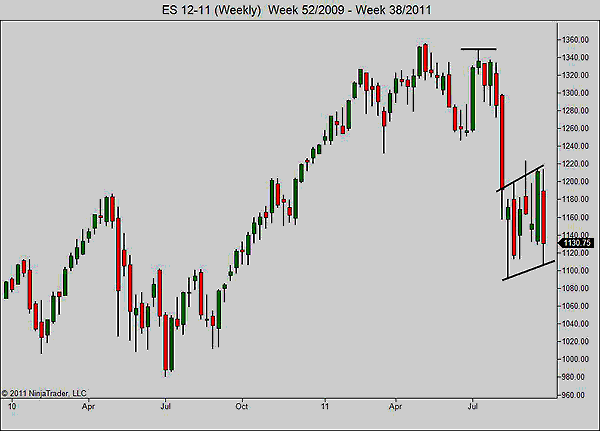
| FIGURE 1: ES, WEEKLY |
| Graphic provided by: NinjaTrader. |
| |
| The past seven straight calendar weeks for the S&P 500 futures have held inside a very crisp, very distinct sideways range. Highs around 1220 and lows around 1110 have defined the 100-point or so sideways range in this time. What the whole world sees now is a textbook bear flag pattern in the midst of confirmation. See Figure 1. |

|
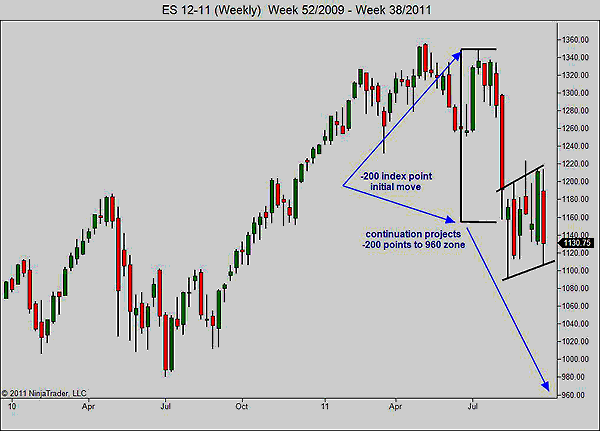
| FIGURE 2: ES, WEEKLY |
| Graphic provided by: NinjaTrader. |
| |
| Basic technical analysis includes measured movement from breakout or breakdown points to consolidation patterns that project equal distance onward when continuation ensues. In this case, the S&P 500 futures moved from +/-1360 highs to 1160 midpoint of the bear flag consolidation. A measured projection from that range down through this pending continuation pattern confirmed would target the ES 960 range. See Figure 2. |

|
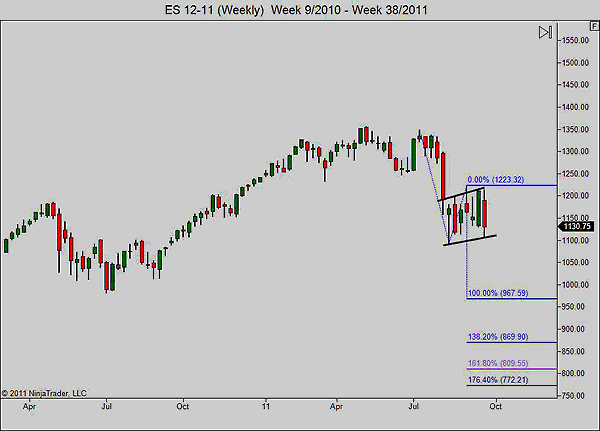
| FIGURE 3: ES, WEEKLY |
| Graphic provided by: NinjaTrader. |
| |
| Added to that viewpoint is a second technical measurement where the current high-low-lower high, 1-2-3 swing measures a Fibonacci projection scale that shows 100% value likewise near the 960 level. Two completely different technical analysis price-action studies reach the same mathematical conclusion. |
| The longer-term view suggests a continuation break lower from this seven-week sideways consolidation should materialize near its 960 area before seeking a new direction from there. Lower price objectives in the 800s and lower are also part of this scale. Unless the S&P 500 musters strength to break above the 1220s highs and base there for support, it is likely to continue lower. |
Austin is a private trader who trades emini stock index futures intraday. He currently trades various futures markets from home in addition to managing a trader's educational forum
| Title: | Individual Trader |
| Company: | CoiledMarkets.com |
| Address: | PO Box 633 |
| Naples, NY 14512 | |
| Website: | coiledmarkets.com/blog |
| E-mail address: | austinp44@yahoo.com |
Traders' Resource Links | |
| CoiledMarkets.com has not added any product or service information to TRADERS' RESOURCE. | |
Click here for more information about our publications!
PRINT THIS ARTICLE

Request Information From Our Sponsors
- StockCharts.com, Inc.
- Candle Patterns
- Candlestick Charting Explained
- Intermarket Technical Analysis
- John Murphy on Chart Analysis
- John Murphy's Chart Pattern Recognition
- John Murphy's Market Message
- MurphyExplainsMarketAnalysis-Intermarket Analysis
- MurphyExplainsMarketAnalysis-Visual Analysis
- StockCharts.com
- Technical Analysis of the Financial Markets
- The Visual Investor
- VectorVest, Inc.
- Executive Premier Workshop
- One-Day Options Course
- OptionsPro
- Retirement Income Workshop
- Sure-Fire Trading Systems (VectorVest, Inc.)
- Trading as a Business Workshop
- VectorVest 7 EOD
- VectorVest 7 RealTime/IntraDay
- VectorVest AutoTester
- VectorVest Educational Services
- VectorVest OnLine
- VectorVest Options Analyzer
- VectorVest ProGraphics v6.0
- VectorVest ProTrader 7
- VectorVest RealTime Derby Tool
- VectorVest Simulator
- VectorVest Variator
- VectorVest Watchdog
