HOT TOPICS LIST
- MACD
- Fibonacci
- RSI
- Gann
- ADXR
- Stochastics
- Volume
- Triangles
- Futures
- Cycles
- Volatility
- ZIGZAG
- MESA
- Retracement
- Aroon
INDICATORS LIST
LIST OF TOPICS
PRINT THIS ARTICLE
by Donald W. Pendergast, Jr.
Most traders and serious investors would be likely to agree with the assertion that the broad US market is very close to either a significant rally or decline. Which scenario is more likely?
Position: N/A
Donald W. Pendergast, Jr.
Donald W. Pendergast is a financial markets consultant who offers specialized services to stock brokers and high net worth individuals who seek a better bottom line for their portfolios.
PRINT THIS ARTICLE
TRADING SYSTEMS
Russell 2000 Awaiting Short Sell Trigger
09/27/11 09:03:31 AMby Donald W. Pendergast, Jr.
Most traders and serious investors would be likely to agree with the assertion that the broad US market is very close to either a significant rally or decline. Which scenario is more likely?
Position: N/A
| Making stock market (or even commodity market) predictions is a fool's game, and the markets have a way of making even the best predictors look awfully silly from time to time, myself included -- when I was crazy enough to play that game, anyway. With that said, however, there's no reason not to technically size up a given market for the probabilities of a continued move in a bullish, bearish, or even sideways direction, so long as we never commit real money to the markets until we have a technically reliable system and risk management program in place to guide us throughout the entire course of the trade. Here's a look at one of the best trading systems around and what its current position is in the Russell 2000 index (.RUT, IWM) is. See Figure 1. |

|
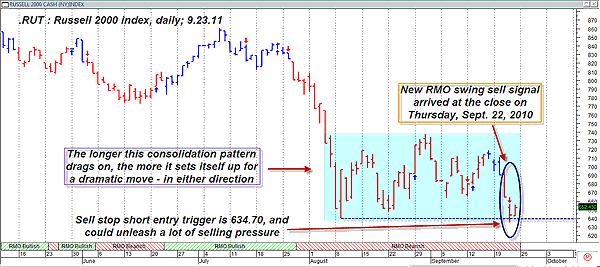
| FIGURE 1: .RUT, DAILY. Long in the tooth? Five weeks of decline followed by seven weeks of consolidation may suggest that the market could be considering moving out of its range-bound state in a big way, perhaps soon, as this new RMO swing sell signal may be hinting. |
| Graphic provided by: MetaStock. |
| Graphic provided by: RMO indicators and tools from MetaStock 11. |
| |
| The current consolidation in the daily chart of the Russell 2000 index is maturing, and the longer it continues in this minor-grade upswing, downswing, and repeat mode, the sooner it is likely to burst out of the pattern with some degree of directional conviction and longevity. To this end, the recent appearance of a Rahul Mohindar oscillator (RMO) swing sell signal at the close of trading on Thursday, September 23, 2011, is worth taking note of. First off, the sell signal occurs at a price level that is already the extreme low of the entire consolidation, and a drop below that leaves this key small-cap index wide open for a potential drop toward the 587.00 to 588.00 area, which is the next meaningful support level, one established during the summer of 2010. Second, the aforementioned maturity of the pattern also suggests that one of two outcomes are likely here: 1. A break below Thursday's low and then a fast drop below the 600 price zone, or: 2. A minor fakeout drop below Thursday's low, followed by a wide range, high volume intraday reversal bar, one that finally sets the stage for a strong rally for the next month or two -- at the very least. As always, no matter which way the market ultimately goes, always stick with the strongest relative strength stocks from the strongest industry groups during bullish breakout attempts (in the broad market indexes like the .RUT.NDX and .SPX) and with weak relative strength stocks from weak industry groups during bearish breakout attempts. Use wise position sizing and spread your stock buys and sells over a period of sessions to help minimize the deleterious effects of sudden market reversals that tend to aggravate the losses in a fully positioned portfolio. |
| The end of the year can and does produce some astounding market rallies from time to time -- and the seasonal charts prove this out over the long term -- but always be aware that this cyclical tendency can also decide not to appear just when you thought it was its job to bail you out, make you money, or put your portfolio on easy street. Be nimble, be safe, and always be prepared, no matter what Mr. Market might decide to do in the days, weeks, and months ahead. |
Donald W. Pendergast is a financial markets consultant who offers specialized services to stock brokers and high net worth individuals who seek a better bottom line for their portfolios.
| Title: | Writer, market consultant |
| Company: | Linear Trading Systems LLC |
| Jacksonville, FL 32217 | |
| Phone # for sales: | 904-239-9564 |
| E-mail address: | lineartradingsys@gmail.com |
Traders' Resource Links | |
| Linear Trading Systems LLC has not added any product or service information to TRADERS' RESOURCE. | |
Click here for more information about our publications!
Comments

Request Information From Our Sponsors
- StockCharts.com, Inc.
- Candle Patterns
- Candlestick Charting Explained
- Intermarket Technical Analysis
- John Murphy on Chart Analysis
- John Murphy's Chart Pattern Recognition
- John Murphy's Market Message
- MurphyExplainsMarketAnalysis-Intermarket Analysis
- MurphyExplainsMarketAnalysis-Visual Analysis
- StockCharts.com
- Technical Analysis of the Financial Markets
- The Visual Investor
- VectorVest, Inc.
- Executive Premier Workshop
- One-Day Options Course
- OptionsPro
- Retirement Income Workshop
- Sure-Fire Trading Systems (VectorVest, Inc.)
- Trading as a Business Workshop
- VectorVest 7 EOD
- VectorVest 7 RealTime/IntraDay
- VectorVest AutoTester
- VectorVest Educational Services
- VectorVest OnLine
- VectorVest Options Analyzer
- VectorVest ProGraphics v6.0
- VectorVest ProTrader 7
- VectorVest RealTime Derby Tool
- VectorVest Simulator
- VectorVest Variator
- VectorVest Watchdog
