HOT TOPICS LIST
- MACD
- Fibonacci
- RSI
- Gann
- ADXR
- Stochastics
- Volume
- Triangles
- Futures
- Cycles
- Volatility
- ZIGZAG
- MESA
- Retracement
- Aroon
INDICATORS LIST
LIST OF TOPICS
PRINT THIS ARTICLE
by Koos van der Merwe
W.D. Gann's time cycle count seems to think so.
Position: Buy
Koos van der Merwe
Has been a technical analyst since 1969, and has worked as a futures and options trader with First Financial Futures in Johannesburg, South Africa.
PRINT THIS ARTICLE
GANN
Is It Time To Buy Gold?
09/26/11 09:32:52 AMby Koos van der Merwe
W.D. Gann's time cycle count seems to think so.
Position: Buy
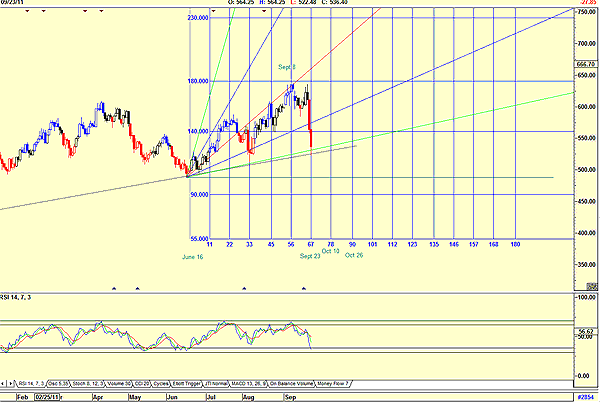
| When W.D. Gann passed away, he left a study full of papers and ideas that caused many people to attempt to duplicate his prediction and trading capabilities. Gann used many techniques, some simple and easy to understand, while others are terribly obscure. His papers accumulated over a lifetime of study filled an entire moving van, which suggested that there was no single technique he used to produce the remarkable results he did. Everyone knows that Gann looked at astronomy for guidance. Whether he was successful in this side of his work is debatable. One thing however is very clear; September 22 was the equinox, which according to Gann should be a cyclical turning point in the market. September 22 did see a major crash in the market, with September 23 seeing a pause and slight recovery. The days ahead will show us whether Gann was correct in this avenue of his work. Figure 1 of the Amex gold bugs index shows another of his cyclical theories, which, as the chart shows, does have some merit. |

|
| FIGURE 1: AMEX GOLD BUGS INDEX |
| Graphic provided by: AdvancedGET. |
| |
| Gann believed in the square of 90 degrees. This was the basis of his Gann fan, taken from a major low. He also believed that the square of 90 can provide turning points based on subdivisions of 90, with 4 x 90 leading to a circle 0f 360 degrees. He would then divide the circle into the following time series: 11-22-33-45-56-67-78-90-101-112-135-146-157-168-180. These market-day counts are very often indications of exact changes in the trend to the day. Note how on the chart the market reversed on day 22. With five trading days in a month, and allowing for error with public holidays, or 31-day months, note how the Amex Gold bugs index came close to reversing on day 22. The market did correct on day 33, and 33 market days is often very close to 45 calendar days. From this point on, the relationship to calendar days breaks down, but the chart did respect day 45, and especially day 56. Day 67 was September 23, one day after the equinox. By all accounts, if Gann's cyclical analysis is correct, we should now see a rise into day 78, which is October 10. With the relative strength index (RSI) in oversold levels, this is indeed possible. The chart does show a Gann fann, drawn from the low of June 16. The Gann squares drawn, however, are drawn from a previous low not shown on the chart. Do note, however, that the 180 degrees did identify the high of Sept 8, day 56. Analysis using Gann time dates does suggest that gold has made a low, with a rise into day 78, October 10. With October notorious for its major market crashes, this is a date we should watch. |
Has been a technical analyst since 1969, and has worked as a futures and options trader with First Financial Futures in Johannesburg, South Africa.
| Address: | 3256 West 24th Ave |
| Vancouver, BC | |
| Phone # for sales: | 6042634214 |
| E-mail address: | petroosp@gmail.com |
Click here for more information about our publications!
PRINT THIS ARTICLE

|

Request Information From Our Sponsors
- StockCharts.com, Inc.
- Candle Patterns
- Candlestick Charting Explained
- Intermarket Technical Analysis
- John Murphy on Chart Analysis
- John Murphy's Chart Pattern Recognition
- John Murphy's Market Message
- MurphyExplainsMarketAnalysis-Intermarket Analysis
- MurphyExplainsMarketAnalysis-Visual Analysis
- StockCharts.com
- Technical Analysis of the Financial Markets
- The Visual Investor
- VectorVest, Inc.
- Executive Premier Workshop
- One-Day Options Course
- OptionsPro
- Retirement Income Workshop
- Sure-Fire Trading Systems (VectorVest, Inc.)
- Trading as a Business Workshop
- VectorVest 7 EOD
- VectorVest 7 RealTime/IntraDay
- VectorVest AutoTester
- VectorVest Educational Services
- VectorVest OnLine
- VectorVest Options Analyzer
- VectorVest ProGraphics v6.0
- VectorVest ProTrader 7
- VectorVest RealTime Derby Tool
- VectorVest Simulator
- VectorVest Variator
- VectorVest Watchdog
