

HOT TOPICS LIST
- MACD
- Fibonacci
- RSI
- Gann
- ADXR
- Stochastics
- Volume
- Triangles
- Futures
- Cycles
- Volatility
- ZIGZAG
- MESA
- Retracement
- Aroon
INDICATORS LIST
LIST OF TOPICS
PRINT THIS ARTICLE
by Donald W. Pendergast, Jr.
A very reliable MetaStock expert advisor is suggesting that the Russell 2000 index has the potential to face more downside in the next week or two, at the very least.
Position: N/A
Donald W. Pendergast, Jr.
Donald W. Pendergast is a financial markets consultant who offers specialized services to stock brokers and high net worth individuals who seek a better bottom line for their portfolios.
PRINT THIS ARTICLE
CHART ANALYSIS
With IWM, Small Caps Ready To Tumble Again?
09/23/11 11:39:51 AMby Donald W. Pendergast, Jr.
A very reliable MetaStock expert advisor is suggesting that the Russell 2000 index has the potential to face more downside in the next week or two, at the very least.
Position: N/A
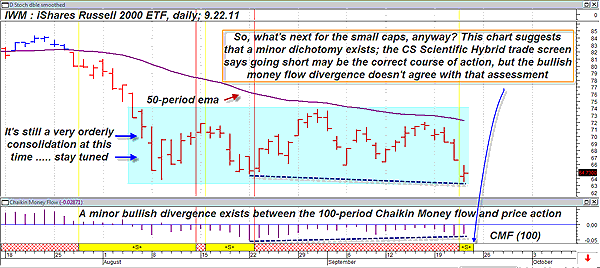
| The variety of expert advisor overlays available in MetaStock 11 might seem to beoverwhelming at first glance, but as you get better acquainted with the way that they help fine-tune your own unique trading style, you'll probably find that you only need to rely on one or two of them on a regular basis. My personal favorite is the CS Scientific Hybrid Trade screen, although the RMO + Swing Trade + Market Trend expert would have to rank a very close second place. Both advisors will help you determine the trend on the time frames you use to chart the stocks and futures contracts you like to trade, and they can also help simplify your broad market timing question too, which is no small feat, given all of the conflicting advice available on the Internet, TV, newsletters, and financial publications. Let's use the CS Scientific Hybrid Trade screen expert advisor to help discern the current technical state of the Russell 2000 index, using the daily chart for IWM. See Figure 1. |
|
| FIGURE 1: IWM, DAILY. When two significant technical analysis techniques are in conflict about the most likely pathway for the market in the days ahead, wise traders will probably want to just stand aside until the market more clearly tips its hand. |
| Graphic provided by: MetaStock. |
| Graphic provided by: CS Scientific Expert Advisor from MetaStock 11. |
| |
| Let's start with the bullish case for IWM first: * The daily chart is manifesting a moderately bullish price/money flow divergence (based on the 100-period Chaikin money flow, or [CMF][100]), which suggests that the major institutions are slowly putting money back to work after the July/August smash. * The entire seven-week long consolidation (see blue shaded area on the chart) has been very orderly so far and is now relatively advanced in age compared to the length of the decline preceding it; if this latest mini selloff fails and the market suddenly reverses in a big way, expect to see a sizable rally emerge from the rubble of the summer crash. |
| Now, let's go on to the bearish case made by the CS Scientific expert advisor, as shown by the newly appeared yellow ribbon (see blue arrow). Typically, when one of these yellow ribbons shows up and the money flow is below zero (depending on what values you use, of course), you can expect a tradable decline to occur shortly thereafter. Of course, some declines are only temporary, and the market roars back to life just a few sessions later. But at other times, the appearance of the yellow ribbon leads to a marked decline in which serious "sell the market short" money can be made by experienced traders and investors. Personally, I would be biased to short the Russell 2000 index here, except for the bullish long-term money flow divergence that was mentioned earlier. So, for now, I will sit on the sidelines and wait for an ambivalent market setup before putting money to work in either direction in the Russell 2000 index (IWM, .RUT). Aggressive intraday traders (those using five- to 15-minute charts) might still want to go short on pullbacks to key intraday resistance levels, being sure to run fairly close stops just in case the index decides to take flight a little early for the typical year-end rally. Just be sure to exit by the close of the session so you don't get mauled by the bear and then hauled away by the market meat wagon. |
Donald W. Pendergast is a financial markets consultant who offers specialized services to stock brokers and high net worth individuals who seek a better bottom line for their portfolios.
| Title: | Writer, market consultant |
| Company: | Linear Trading Systems LLC |
| Jacksonville, FL 32217 | |
| Phone # for sales: | 904-239-9564 |
| E-mail address: | lineartradingsys@gmail.com |
Traders' Resource Links | |
| Linear Trading Systems LLC has not added any product or service information to TRADERS' RESOURCE. | |
Click here for more information about our publications!
PRINT THIS ARTICLE

Request Information From Our Sponsors
- StockCharts.com, Inc.
- Candle Patterns
- Candlestick Charting Explained
- Intermarket Technical Analysis
- John Murphy on Chart Analysis
- John Murphy's Chart Pattern Recognition
- John Murphy's Market Message
- MurphyExplainsMarketAnalysis-Intermarket Analysis
- MurphyExplainsMarketAnalysis-Visual Analysis
- StockCharts.com
- Technical Analysis of the Financial Markets
- The Visual Investor
- VectorVest, Inc.
- Executive Premier Workshop
- One-Day Options Course
- OptionsPro
- Retirement Income Workshop
- Sure-Fire Trading Systems (VectorVest, Inc.)
- Trading as a Business Workshop
- VectorVest 7 EOD
- VectorVest 7 RealTime/IntraDay
- VectorVest AutoTester
- VectorVest Educational Services
- VectorVest OnLine
- VectorVest Options Analyzer
- VectorVest ProGraphics v6.0
- VectorVest ProTrader 7
- VectorVest RealTime Derby Tool
- VectorVest Simulator
- VectorVest Variator
- VectorVest Watchdog