HOT TOPICS LIST
- MACD
- Fibonacci
- RSI
- Gann
- ADXR
- Stochastics
- Volume
- Triangles
- Futures
- Cycles
- Volatility
- ZIGZAG
- MESA
- Retracement
- Aroon
INDICATORS LIST
LIST OF TOPICS
PRINT THIS ARTICLE
by Billy Williams
The markets are like oceans where violent storms can flash across the horizon, but if you know how to spot extreme price levels, you can profit and protect yourself at the same time.
Position: Hold
Billy Williams
Billy Williams has been trading the markets for 27 years, specializing in momentum trading with stocks and options.
PRINT THIS ARTICLE
VOLATILITY
VIX Double Tops And Market Reversals
09/26/11 09:16:55 AMby Billy Williams
The markets are like oceans where violent storms can flash across the horizon, but if you know how to spot extreme price levels, you can profit and protect yourself at the same time.
Position: Hold
| Like the oceans, the markets can have periods of calm waters, choppy shores, storms that are gone almost as fast as they came, and then violent seas with huge overlapping winds and waters that can toss about traders and investors alike with some not surviving the event. Markets are literally a sea of human interaction whose behavior is largely dictated by herd behavior that is fueled by human emotion. In trading, emotions like fear, greed and, perhaps the deadliest of all trading emotions, euphoria, are the cause of violent price action, and the effect is a market pushed to dangerous extremes. When price is pushed to an extreme level due to mass emotional trading, it is highly probable that a price reversal will occur. The reason for this is that crowds are often wrong in the market, meaning that when large segments of investment capital are basing their buying and selling on irrational emotions rather than common sense, once the emotion washes away, then it sets the stage for price to snap back in the other direction, much like a rubber band that has been stretched to its limits and then let go to resume its natural state. |

|
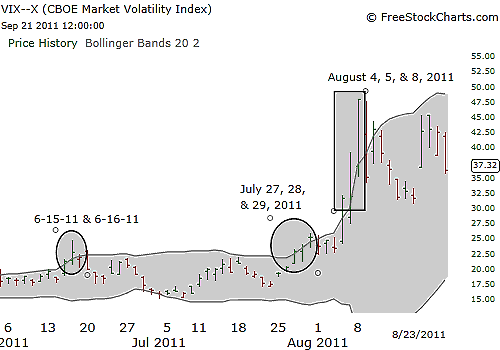
| FIGURE 1: VIX. The VIX reached extreme levels in recent months, revealing that there was a combination of highly emotional trading, which signaled an exit for the longs and also signaled that you should be alert for a strong price reversal. |
| Graphic provided by: www.freestockcharts.com. |
| |
| When this type of phenomenon occurs in the market, you as a trader can benefit by being aware of what is occurring as well as the reasons for it. You can benefit by first riding the wave of momentum, resulting from some piece of economic data or whatever precursor started it by having the ability to gauge when price has reached an extreme price level so you may exit your position and/or prepare to exploit a likely reversal. You can gauge extreme price levels by using the CBOE Volatility Index (VIX) as a tool and combining it with Bollinger Bands to form a timing model to identify those price reversal points on the market. See Figure 1. |

|
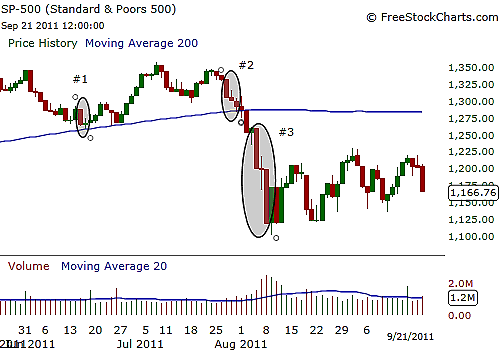
| FIGURE 2: SPX. In the SPX, price corresponded with the VIX's signals by reversing off the bottom after extreme selling. Point 2 reminds you that no indicator is fool-proof, as the VIX had a corresponding triple-close above the upper Bollinger Band, but price still gave way to the bears before finally reversing at point 3. |
| Graphic provided by: www.freestockcharts.com. |
| |
| VIX is a popular measure of the implied volatility of Standard & Poor's 500 index options (Figure 2). Often referred to as the fear index or the fear gauge, it represents one measure of the market's expectation of stock market volatility over the next 30-day period. The VIX has an inverse relationship to the market so when the market is falling, you will see the VIX rise as option traders are buying large quantities of put options and the opposite of when the market is rising. John Bollinger developed the Bollinger Bands by using a moving average with two trading bands above and below it. Unlike a percentage calculation from a normal moving average, Bollinger Bands simply add and subtract a standard deviation calculation. |
| Since price typically reverts to the mean, the Bollinger Bands indicate when price has reached the upper limits of its volatility and when it will revert to its mean, in this case, the median moving average. Place the VIX inside the Bollinger Bands on any charting package and you will see that when the VIX reaches the upper or lower limits of the Bollinger Bands, the market has a high probability of reversing its price back to the mean. However, for increased accuracy, note when price on the VIX closes above or below the outer limits of the Bollinger Band. When this occurs, it marks an extreme level in price where it signals an exit in the current trend and/or preparing to exploit a high-probability price reversal. |
Billy Williams has been trading the markets for 27 years, specializing in momentum trading with stocks and options.
| Company: | StockOptionSystem.com |
| E-mail address: | stockoptionsystem.com@gmail.com |
Traders' Resource Links | |
| StockOptionSystem.com has not added any product or service information to TRADERS' RESOURCE. | |
Click here for more information about our publications!
PRINT THIS ARTICLE

Request Information From Our Sponsors
- StockCharts.com, Inc.
- Candle Patterns
- Candlestick Charting Explained
- Intermarket Technical Analysis
- John Murphy on Chart Analysis
- John Murphy's Chart Pattern Recognition
- John Murphy's Market Message
- MurphyExplainsMarketAnalysis-Intermarket Analysis
- MurphyExplainsMarketAnalysis-Visual Analysis
- StockCharts.com
- Technical Analysis of the Financial Markets
- The Visual Investor
- VectorVest, Inc.
- Executive Premier Workshop
- One-Day Options Course
- OptionsPro
- Retirement Income Workshop
- Sure-Fire Trading Systems (VectorVest, Inc.)
- Trading as a Business Workshop
- VectorVest 7 EOD
- VectorVest 7 RealTime/IntraDay
- VectorVest AutoTester
- VectorVest Educational Services
- VectorVest OnLine
- VectorVest Options Analyzer
- VectorVest ProGraphics v6.0
- VectorVest ProTrader 7
- VectorVest RealTime Derby Tool
- VectorVest Simulator
- VectorVest Variator
- VectorVest Watchdog
