

HOT TOPICS LIST
- MACD
- Fibonacci
- RSI
- Gann
- ADXR
- Stochastics
- Volume
- Triangles
- Futures
- Cycles
- Volatility
- ZIGZAG
- MESA
- Retracement
- Aroon
INDICATORS LIST
LIST OF TOPICS
PRINT THIS ARTICLE
by David Penn
Precious metals are up year-to-date, but will silver, platinum or gold pay off in the end?
Position: N/A
David Penn
Technical Writer for Technical Analysis of STOCKS & COMMODITIES magazine, Working-Money.com, and Traders.com Advantage.
PRINT THIS ARTICLE
HERRICK PAYOFF INDEX
Herrick Payoff Index
04/19/02 10:55:40 AMby David Penn
Precious metals are up year-to-date, but will silver, platinum or gold pay off in the end?
Position: N/A
| With stocks up significantly on the day (the Nasdaq was up more than 3.5%), it seems like as good a time as any to take a look at precious metal futures. WHAT?! Yes, precious metal futures. As I have suggested elsewhere, there is a growing fundamentally-oriented consensus among many "thinking-outside-the-box" money managers and market analysts that the 20-year run for financial assets that began in the early 1980s is finally at an end, and that new leadership will have to come from a different set of assets. Noting the 20-year period leading up to the 1980s was one in which real assets tended to outperform financial assets, many have looked to real assets - gold, commodities, real estate - in search of the next secular bull market. As Mark Boucher put it in his wonderful investment primer "The Hedge Fund Edge" published in 1999: "Who achieved better investment performance from 1965 to 1981... a stock market legend like Warren Buffett or John Templeton, or the average Joe who just happened to buy an investment property in California with most of his spare capital? The average Joe kicked the experts' backsides!" |
| The prism through which I want to look at three precious metals futures contracts (the continuous contracts for silver, platinum and gold) is the Herrick Payoff Index. Developed, appropriately enough, by John Herrick, the Herrick Payoff Index ("HPI" in some drop-down indicator menus) is essentially a money flow indicator for futures contracts. The "flow" in this case is open interest, which is simply the total number of outstanding futures contracts - long and short. Generally speaking, when open interest grows simultaneously with rising prices, it is considered bullish for the futures contract. At the same time, if open interest is growing while prices are falling, it is considered bearish for the futures contract. There are other wrinkles for the two other common situations: shrinking open interest is bearish when prices are rising, but is considered bullish when prices are falling. In this way, open interest is to futures what volume is to stocks. |
|
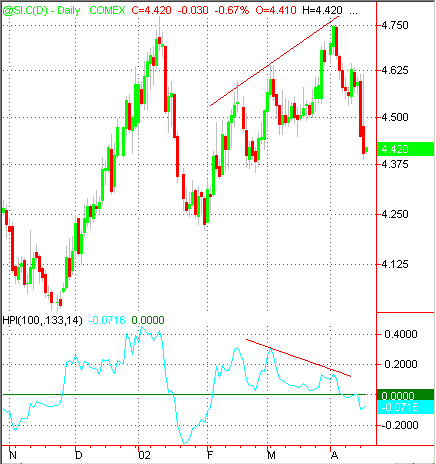
| Figure 1: This bearish divergence between silver futures and the HPI anticipated a 35 cent reversal. |
| Graphic provided by: TradeStation. |
| |
| The most effective way to use the Herrick Payoff Index is to look for confirmations and divergences between the indicator and the futures contract being analyzed. For example, looking at the continuous contract for silver, we note how the HPI trended more or less with silver prices during the October 2001 decline and the late November/December 2001 rally. The HPI also moved with silver during the January 2002 rally. However it is here where the divergences between the HPI and silver futures begin. While the silver futures contract made higher highs in mid-February, early March and early April following the January declines, the HPI was moving steadily lower. In fact, each higher high in the silver futures contract was matched by a lower high in the HPI. This bearish sign proved accurate when silver futures collapsed in mid-April, falling from a peak of $4.75 at the beginning of the month to about $4.40 by mid-month, a loss of 35 cents or approximately $1,750 per contract. |
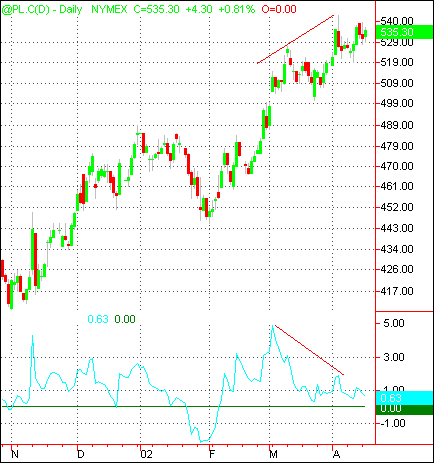 Figure 2. The bearish divergence at the top of this rally in platinum should engender caution in the bulls. If a bearish divergence between the futures and the Herrick Payoff Index meant that the advance of silver was due for a correction, then what can be said of the divergence between the HPI and the continuous platinum contract? Like the silver futures, platinum futures moved more or less in tandem with their Herrick Payoff Index indicator: staying above zero during the futures advance in the fall of 2001 and falling as platinum futures softened in January 2002. Both the HPI and platinum futures trended upward from the beginning of February to the beginning of March. However, here we again encounter a divergence between price action in the futures and the movement of the indicator. Platinum futures corrected mildly in March and resumed their advance before the month was complete. The Herrick Payoff Index, on the other hand, began moving down at the beginning of March and, but for a short upswing near the beginning of April, has been declining ever since. This should put platinum traders on alert for a possible top in the futures as the divergence continues to grow. |
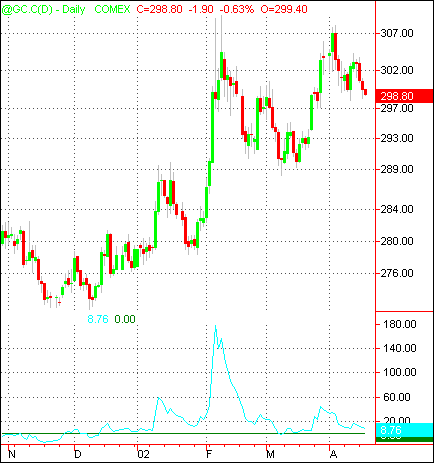 Figure 3. Although more volatile that the other precious metals, gold too can be tracked using the HPI. So much for the easy calls. The contract for gold continuous futures appears on the surface to be much harder to interpret from a Herrick Payoff Index perspective. In part, this is because the continuous gold futures contract is not trending very much, and has the typical spiky "EKG-look" of other volatile commodities. Nevertheless, we can note how the HPI remained under the zero line as gold futures bottomed out in the fall of 2001, and then itself began spiking in concert with the quick, abrupt advances of gold futures at the beginning of February and to a lesser degree in late March/early April. In this case, using the Herrick Payoff Index effectively would involve looking for divergences between the spiky advances in gold and the HPI indicator. For example, if gold futures appear to successfully test the April highs (just above 306 for continuous futures), while the HPI continues to fall, gold traders should be on guard for a possible correction back to lower levels. A point worth underscoring is this: although I have suggested, through the prism of the Herrick Payoff Index, that both platinum and gold look vulnerable (silver looks to have already made much of its correction), it should not be forgotten that all three precious metals are up for the year. Silver is up about 8% since mid-January (the year began with silver correcting sharply from $4.75), platinum is up almost 15% year-to-date, and gold is up about 8% since January 1. So inasmuch as the HPI currently suggests corrections for the precious metals, these corrections may prove to be buying opportunities as well, should current support levels hold fast. |
Technical Writer for Technical Analysis of STOCKS & COMMODITIES magazine, Working-Money.com, and Traders.com Advantage.
| Title: | Technical Writer |
| Company: | Technical Analysis, Inc. |
| Address: | 4757 California Avenue SW |
| Seattle, WA 98116 | |
| Phone # for sales: | 206 938 0570 |
| Fax: | 206 938 1307 |
| Website: | www.Traders.com |
| E-mail address: | DPenn@traders.com |
Traders' Resource Links | |
| Charting the Stock Market: The Wyckoff Method -- Books | |
| Working-Money.com -- Online Trading Services | |
| Traders.com Advantage -- Online Trading Services | |
| Technical Analysis of Stocks & Commodities -- Publications and Newsletters | |
| Working Money, at Working-Money.com -- Publications and Newsletters | |
| Traders.com Advantage -- Publications and Newsletters | |
| Professional Traders Starter Kit -- Software | |
Click here for more information about our publications!
Comments

Request Information From Our Sponsors
- StockCharts.com, Inc.
- Candle Patterns
- Candlestick Charting Explained
- Intermarket Technical Analysis
- John Murphy on Chart Analysis
- John Murphy's Chart Pattern Recognition
- John Murphy's Market Message
- MurphyExplainsMarketAnalysis-Intermarket Analysis
- MurphyExplainsMarketAnalysis-Visual Analysis
- StockCharts.com
- Technical Analysis of the Financial Markets
- The Visual Investor
- VectorVest, Inc.
- Executive Premier Workshop
- One-Day Options Course
- OptionsPro
- Retirement Income Workshop
- Sure-Fire Trading Systems (VectorVest, Inc.)
- Trading as a Business Workshop
- VectorVest 7 EOD
- VectorVest 7 RealTime/IntraDay
- VectorVest AutoTester
- VectorVest Educational Services
- VectorVest OnLine
- VectorVest Options Analyzer
- VectorVest ProGraphics v6.0
- VectorVest ProTrader 7
- VectorVest RealTime Derby Tool
- VectorVest Simulator
- VectorVest Variator
- VectorVest Watchdog