HOT TOPICS LIST
- MACD
- Fibonacci
- RSI
- Gann
- ADXR
- Stochastics
- Volume
- Triangles
- Futures
- Cycles
- Volatility
- ZIGZAG
- MESA
- Retracement
- Aroon
INDICATORS LIST
LIST OF TOPICS
PRINT THIS ARTICLE
by Alan R. Northam
This analysis shows that Alcoa has now completed its bear market consolidation and has resumed its primary bear market trend.
Position: N/A
Alan R. Northam
Alan Northam lives in the Dallas, Texas area and as an electronic engineer gave him an analytical mind from which he has developed a thorough knowledge of stock market technical analysis. His abilities to analyze the future direction of the stock market has allowed him to successfully trade of his own portfolio over the last 30 years. Mr. Northam is now retired and trading the stock market full time. You can reach him at inquiry@tradersclassroom.com or by visiting his website at http://www.tradersclassroom.com. You can also follow him on Twitter @TradersClassrm.
PRINT THIS ARTICLE
STATISTICS
Alcoa Bear Market Resumes
09/22/11 09:37:09 AMby Alan R. Northam
This analysis shows that Alcoa has now completed its bear market consolidation and has resumed its primary bear market trend.
Position: N/A
| On August 18, I wrote an article entitled "Alcoa Bull Market Is Ending" that showed a long-term statistical analysis explaining that the primary bull market in Alcoa was coming to an end. On August 31, I wrote a second article entitled "Alcoa Bear Market Begins" where I explained that Alcoa had just entered into a primary bear market. Today's article shows that Alcoa has now completed its month-long consolidation period and has resumed its primary bear market. |
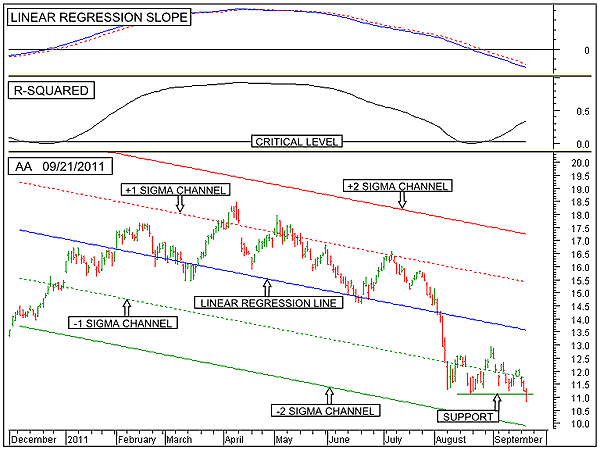
| The lower panel of Figure 1 shows the daily price bars of Alcoa (AA). This figure also shows the 200-day linear regression trendline (blue line) along with the upper one sigma channel line (red dotted line), upper two sigma channel line (red solid line), the lower one sigma channel (green dotted line), and the lower two sigma channel line (solid green line). Figure 1 also shows a short support line (solid green horizontal line). |

|
| FIGURE 1: AA, DAILY. This chart shows the daily price chart of Alcoa (AA), in the lower panel along with its 200-day linear regression trendline and its associated channel lines. The top panel shows the linear regression slope indicator followed by the R-squared indicator in the next lower panel. |
| Graphic provided by: MetaStock. |
| |
| Looking at Figure 1, note that during the period of mid-August to late September, AA moved sideways, consolidating its recent losses during the selloff from early July. Note that during this period, AA never rallied back to the linear regression trendline (solid blue line), a sign of bearish strength. In addition, during the mid-August to late September consolidation period, the linear regression slope indicator continued to move lower. This is an indication that price continues to accelerate in the downward direction. Note that trends do not end until this indicator starts to reverse its direction. Further, note that the R-squared indicator has continued to move upward during the entire consolidation period. This is an indication of increasing strength in the trend. Normally, trends do not end until this indicator moves above 0.7. With this indicator currently reading 0.35, the primary bear market trend has much further to go before it enters into a bottoming stage. |
| Finally, note the last daily trading bar. It has now moved below the green support line, showing that Alcoa has ended its period of consolidation and has resumed its primary bear market trend. |
| In conclusion, Alcoa has now resumed its primary bear market trend. Long-term statistical analysis shows that this primary bear market trend has much further to go before the stock enters into a bottoming process. |
Alan Northam lives in the Dallas, Texas area and as an electronic engineer gave him an analytical mind from which he has developed a thorough knowledge of stock market technical analysis. His abilities to analyze the future direction of the stock market has allowed him to successfully trade of his own portfolio over the last 30 years. Mr. Northam is now retired and trading the stock market full time. You can reach him at inquiry@tradersclassroom.com or by visiting his website at http://www.tradersclassroom.com. You can also follow him on Twitter @TradersClassrm.
| Garland, Tx | |
| Website: | www.tradersclassroom.com |
| E-mail address: | inquiry@tradersclassroom.com |
Click here for more information about our publications!
PRINT THIS ARTICLE

Request Information From Our Sponsors
- StockCharts.com, Inc.
- Candle Patterns
- Candlestick Charting Explained
- Intermarket Technical Analysis
- John Murphy on Chart Analysis
- John Murphy's Chart Pattern Recognition
- John Murphy's Market Message
- MurphyExplainsMarketAnalysis-Intermarket Analysis
- MurphyExplainsMarketAnalysis-Visual Analysis
- StockCharts.com
- Technical Analysis of the Financial Markets
- The Visual Investor
- VectorVest, Inc.
- Executive Premier Workshop
- One-Day Options Course
- OptionsPro
- Retirement Income Workshop
- Sure-Fire Trading Systems (VectorVest, Inc.)
- Trading as a Business Workshop
- VectorVest 7 EOD
- VectorVest 7 RealTime/IntraDay
- VectorVest AutoTester
- VectorVest Educational Services
- VectorVest OnLine
- VectorVest Options Analyzer
- VectorVest ProGraphics v6.0
- VectorVest ProTrader 7
- VectorVest RealTime Derby Tool
- VectorVest Simulator
- VectorVest Variator
- VectorVest Watchdog
